Main Menu
Main Dashboard Overview – Ramsys Central ERP
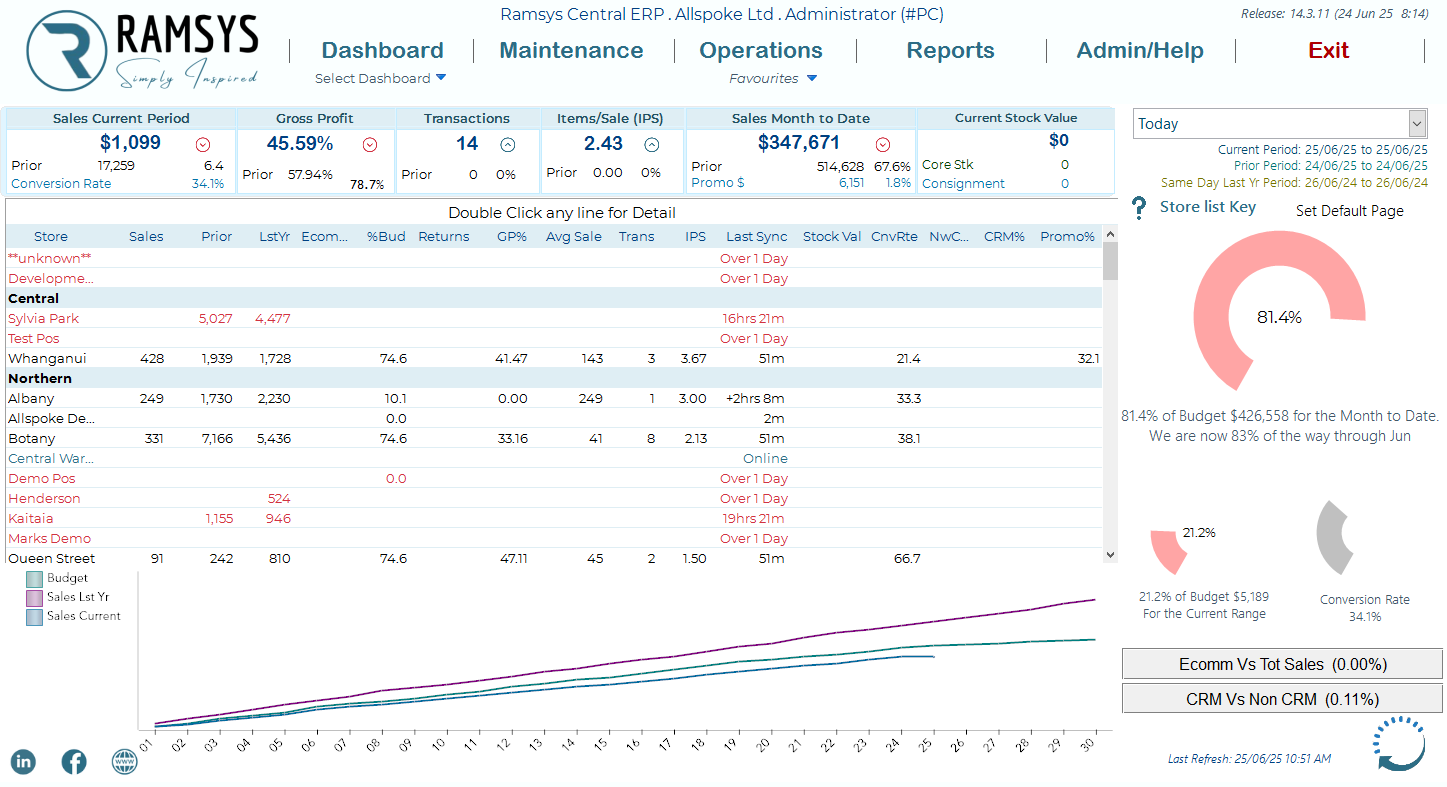
The Main Dashboard in Ramsys Central ERP provides a comprehensive, real-time overview of business performance metrics across stores. This is the central starting point for administrators and users.
Menus are in the form of hyperlinks, click these as you would any other web link to access features. This dashboard is designed to:
- Provide a snapshot of current sales, gross profit, transactions, and stock.
- Compare performance to prior periods and budgets.
- Allow drill-down into individual store performance.
- Track stock synchronisation and conversion metrics.
- Offer quick visual insight into overall progress toward monthly goals.
Header Bar
Dashboard Selector: Switch between different dashboard views (e.g., Sales, Stock, CRM).
Main Menu Tabs: Access modules like Dashboard, Maintenance, Operations, Reports, and Admin/Help.
Exit: Safely exit the system.
User Info: Top right displays logged-in user role and PC identifier.
Top Summary Row
|
Label |
Description |
|
Sales Current Period |
Total sales made in the currently selected date range. |
|
Gross Profit |
GP% for the current period with comparison to prior. |
|
Transactions |
Total number of transactions recorded. |
|
Items/Sale (IPS) |
Average number of items sold per transaction. |
|
Sales Month to Date |
Cumulative sales this month vs. prior month’s figures and budget %. |
|
Current Stock Value |
Real-time value of core and consignment stock. |

Store Performance Grid
Each row represents a store (or test/development site), showing:
Sales, Prior, Last Yr: Figures for current, prior period, and previous year.
Ecomm% / Budget: Share of ecommerce sales and budget comparison.
Returns, GP%, Avg Sale, Transactions, IPS: Detailed store-level metrics.
Last Sync: Time since last sync to central.
Stock Val: Store’s current stock value.
Conversion Rate (CnvRate): % of visitors converting to sales.
NWC, CRM%, Promo%: Other metrics like New Customer %, CRM contribution, and promotional sales.
Double-click any line to view detailed performance breakdown.
Store List Key (Right Panel)
Doughnut Gauge: Shows % of the month’s budget achieved so far.
Small Gauge: Displays the same stat for the currently selected range (e.g., today).
Date Range Selector: Filter the screen to show data for a specific period.
Ecomm vs Total Sales: Compares ecommerce with total.
CRM vs Non-CRM: Compares CRM-attributed sales with others.
Sales Trend Graph (Bottom Panel)
A cumulative sales graph comparing:
Budget (purple),
Last Year Sales (blue), and
Current Year Sales (teal).
This helps assess sales performance trajectory throughout the month.
Notes
Red Text Warnings indicate syncing issues or stale data.
Online/Over 1 Day/Time Since Last Sync provides diagnostics for store connectivity.
Test and Demo Stores are not included in live sales reporting.
Tips
Hover over graph points for day-by-day insights.
Keep an eye on sync times to ensure stores are reporting in real-time.
Use filters to isolate specific date ranges or focus on under performing branches.