Sales by Time
Sales by Time Report
The Sales by Time report provides insights into sales activity across different time intervals and days of the week. It is especially useful for identifying peak hours and optimising staffing and promotions.
Controls and Fields
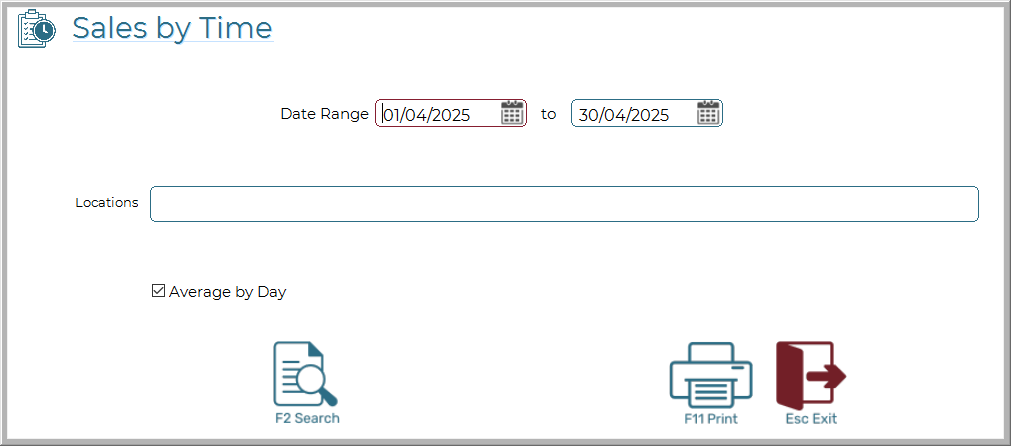
Date Range (From – To)
Select the date range for which you want to analyse sales. Use the calendar icons to choose start and end dates.
Locations
Optionally double click to select one or more locations (e.g., store codes or names) to filter the report. Leave blank to include all locations.
Average by Day
When checked, the report shows average transaction count and sales per 15-minute interval by day of the week (e.g., Monday, Tuesday). This helps you compare patterns across days.
F2 Search
Click to generate the report based on the selected filters.
F11 Print
Click to print the report.
Esc Exit
Click to exit the screen.
Report Output
When generated, the report will show:
Location
Day Name (e.g., Monday)
Time Interval (15-minute blocks such as 09:00, 09:15, etc.)
Average Transaction Count (if "Average by Day" is checked)
Average Sales (if "Average by Day" is checked)
Otherwise, raw totals are shown for each interval/day.
Use Cases
Identify slow or busy periods for staffing decisions
Compare performance between weekdays and weekends
Track changes in customer flow patterns over time