Performance
Performance Overview
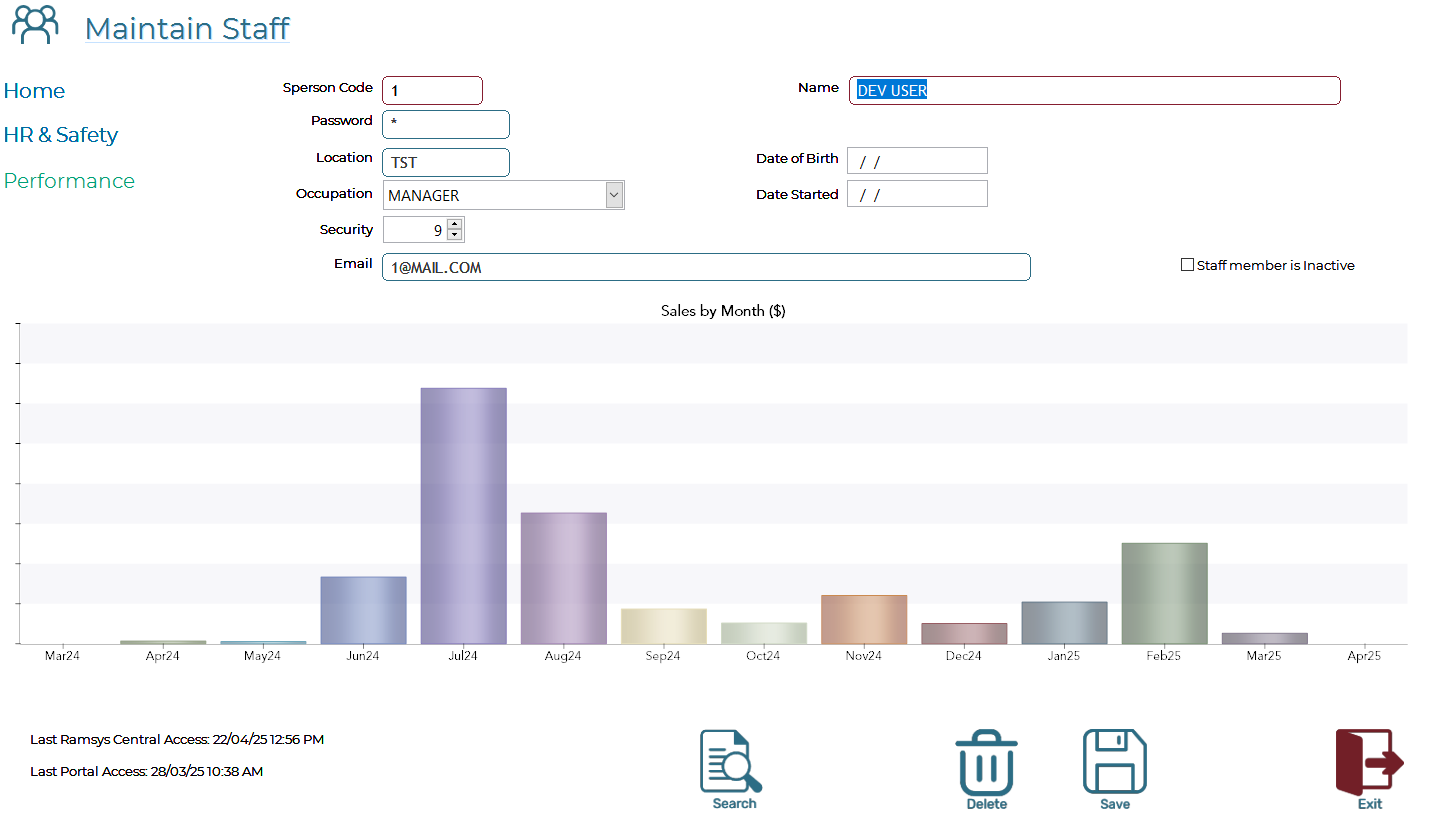
The Performance page provides a visual representation of a staff member’s monthly sales performance over the last 13 months. This feature is designed to support staff reviews, identify trends, and promote accountability through clear, data-driven insights.
Key Features:
- Bar Graph Display: The page displays a bar graph showing total sales for each of the past 13 months. Each bar represents one calendar month.
- Trend Analysis: Easily identify patterns in performance such as growth, consistency, or decline.
- Individual Focus: The graph is staff-specific, ensuring the data reflects only the selected team member.
- Rolling 13-Month Window: The chart updates monthly to always show the most recent 13-month period.
Usage Tips:
- Use the graph during performance reviews or coaching sessions to illustrate achievements or areas for improvement.
- Look for seasonal trends or dips that may highlight training needs or operational changes.
- Use alongside other HR and safety records to form a complete picture of staff engagement and output.