Sales
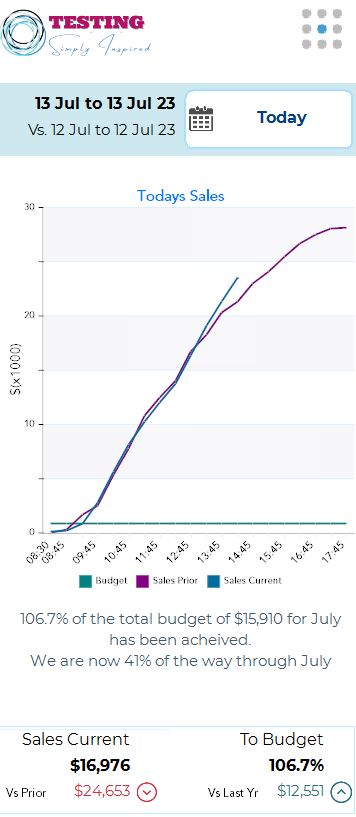
This is the default screen. This graph clearly lays out the progress for the selected range, Series mapped are;
- Sales Current Period
- Sales Prior Period
- Budget for the Current Period

The current and prior period are displayed beside the date selection button
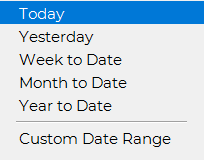
The default range for this Dashboard is today, with the prior period being yesterday. To select another date range, simply click on the drop-down box and choose your desired date range.

Below the following Statistics are displayed, these are viewable on every page bar the menu
- Total Sales - Current range
- Total Sales - Prior Range. a graphic to show if you are ahead or behind this value. if behind it will be in Red.
- % of Budget - any value above 100% is ahead of budget.
- Total sales for last year - will be in Red if you are behind last yr for the same period