Account Customer Performance
Account Customer Performance Dashboard
This screen provides a clear, month-by-month view of customer behaviour for the selected account. It combines spend, returning customer activity, and customer quality (RFM) into a single dashboard to help you understand how customers are interacting with your business over time.
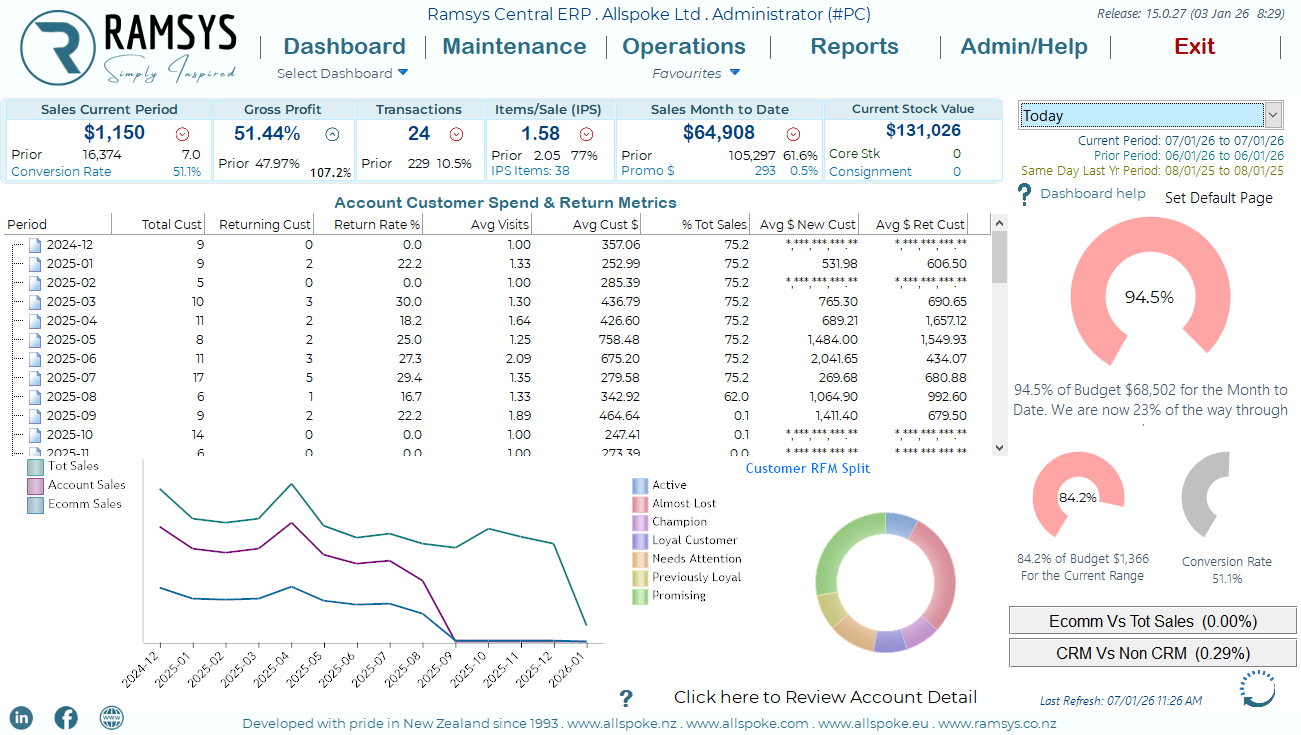
Account Customer Spend & Return Metrics Grid
The grid at the top of the screen shows key metrics by month (Period).
Column explanations
- Period - The calendar month the data relates to.
- Total Cust - The total number of unique customers who purchased during the period.
- Returning Cust - The number of customers who have purchased before and returned during this period.
- Return Rate % - The percentage of customers who are returning customers. (Returning Customers ÷ Total Customers)
- Avg Visits - The average number of visits per customer during the period.
- Avg Cust $ - The average spend per customer for the period.
- % Tot Sales - The percentage of total sales this account contributed for the period.
- Avg $ New Cust - The average spend of new customers only.
- Avg $ Ret Cust - The average spend of returning customers only.
Note:
If a column displays ******, it means there is insufficient data for that period (for example, no new or returning customers).
Sales Trend Graph (Bottom Left)
The line graph shows sales performance over time, broken into three distinct sales channels:
Total Sales – Overall sales value
Account Sales – Sales attributed to account customers
Ecomm Sales – Sales made via the website
The horizontal axis represents time (months)
The vertical axis represents sales value
Each line shows how sales trend over time for that category
This graph is useful for quickly identifying:
Growth or decline trends
Seasonal patterns
Differences between in-store/account and online sales
Customer RFM Split (Bottom Right)
The Customer RFM Split chart classifies customers based on Recency, Frequency, and Monetary value.
Customer categories
Champion – Your best customers: frequent, recent, and high spenders
Loyal Customer – Regular customers with consistent spend
Active – Recently engaged customers
Promising – New or developing customers
Needs Attention – Customers showing reduced engagement
Previously Loyal – Past strong customers who have slowed
Almost Lost – Customers at risk of being lost
The size of each segment represents the proportion of customers in that category.
Reviewing Account Detail
At the bottom of the screen, select:
“Click here to Review Account Detail”
This opens a detailed breakdown of the selected account, allowing you to:
Drill into individual customer activity
Review transaction history
Analyse behaviour behind the summary figures
How This Screen Is Typically Used
This screen is designed for:
Monitoring customer retention trends
Understanding customer value over time
Identifying opportunities to re-engage at-risk customers
Measuring the effectiveness of marketing and loyalty initiatives
It provides a high-level overview first, with the ability to drill deeper where required.