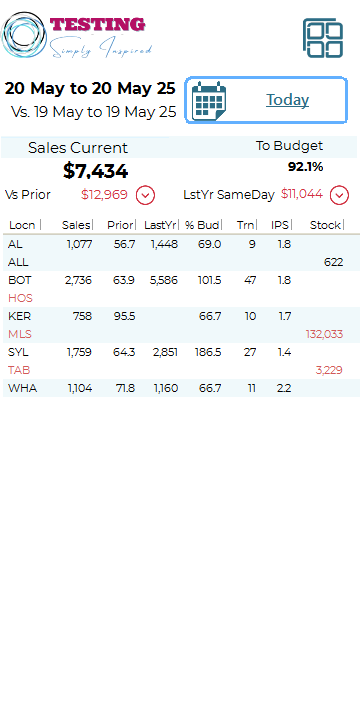
Store Performance
The Store performance provides similar information to the Main Menu dashboard on the full version.

In the Store performance section, you can easily view the total sales for both the current and prior periods.
At the top right-hand corner, you will find the dates corresponding to the selected range.
The meter bar provides a visual comparison between the budget and sales. The green bar represents the sales, indicating growth, while the remaining budget is represented by the red portion. The budget is also displayed as a percentage, along with the percentage of the month completed. This information is particularly useful when using the Month to Date range. For example, if you have achieved 41% of the budget after 53% of the month has passed.
The grid displays the following information:
- Locn: Short code for the location, saving space on a mobile phone screen.
- Sales: Total sales for the selected range in dollars ($).
- Prior %: Percentage of sales achieved compared to the prior range.
- LstYr %: Percentage of sales achieved compared to the same period last year for the current range.
- Bud %: Percentage of sales achieved compared to the budget for the current range.
- Trans: Number of transactions for the current range.
- IPS: Items per Sale for the current range.
- StkLvl: Stock-level as of the last current date.
Double tap any location to see the detail line, this will display the budget for the selected period as a $ value. See the example in the image for locations "HED" and "SYL"
Note: The percentage figures indicate the percentage achieved. A positive percentage means you are ahead, while a negative figure means you are behind.