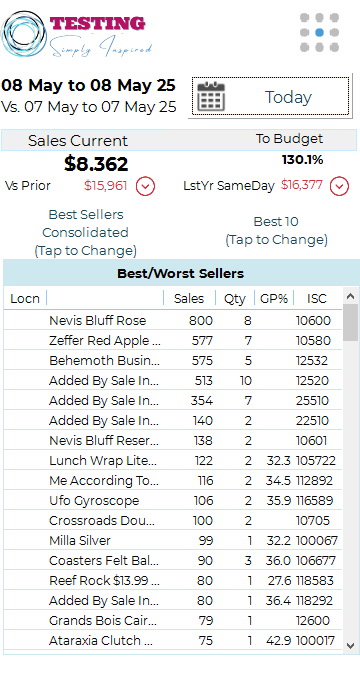
Best/Worst Sellers
The Best/Worst Sellers screen provides a powerful snapshot of item-level performance, allowing users to quickly identify top-selling products and those that may be under performing. It’s ideal for managers, buyers, and marketing teams focused on optimising inventory and promotions.
🧠 Interactive Filters
- Best Sellers Consolidated: Tap to toggle between consolidated totals and individual item breakdowns.
- Best 10 (Tap to Change): Filter the view to show the number of items, or a full ranked list of items.
📋 Table Columns Explained
|
Column |
Description |
|
Locn |
The location code where the sale occurred (if applicable). |
|
Item Name |
The name of the product sold. |
|
Sales |
Dollar value of sales for the item. |
|
Qty |
Quantity of units sold. |
|
GP% |
Gross Profit % for the item. |
|
ISC |
Internal Stock Code (unique item identifier). |
🔽 Scroll vertically to view more items in the list.
Use Cases
- Identify Top Performers: Focus on best-selling products by sales value or quantity.
- Spot Slow Movers: Detect under performing products for review or markdown.
- Compare GP Margins: Evaluate profitability at the item level to guide pricing strategies.
- Branch-Level Analysis: When applicable, compare sales across locations using the Location column.
💡 Tip: Combine this screen with the Weekly Summary and Sales by Time reports for more nuanced sales trend analysis.