Sales by Time
Portal Sales Dashboard – Sales by Time
This screen provides a real-time snapshot of current sales performance for the day across all stores or a specific location by time broken into 30 minute increments.
Location Selector
- Drop down to filter results by a specific store or view all locations.
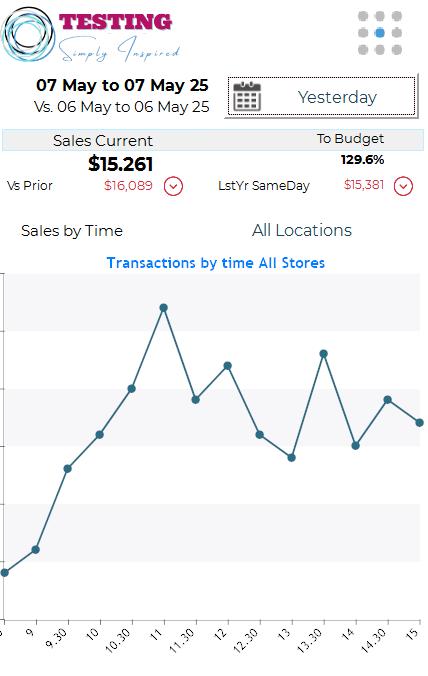
Graph – Transactions by Time
- X-Axis: Time of day (in half hourly blocks)
- Y-Axis: Number of transactions
- The line graph provides visual insight into peak transaction periods throughout the day.
- Title changes dynamically based on location selection:
e.g., “Transactions by time All Stores”
Usage Tips
- Use this screen to monitor performance hourly and adjust operations or staffing as needed.
- Compare against prior and budget data to track whether daily targets are on pace.
- Use the location filter to zoom into specific stores for deeper analysis.