BestSellers
The Best/Worst Sellers Report screen allows you to generate a detailed list of your top-performing or under-performing products over a selected time range. This report helps with inventory management, purchasing decisions, and promotional planning.
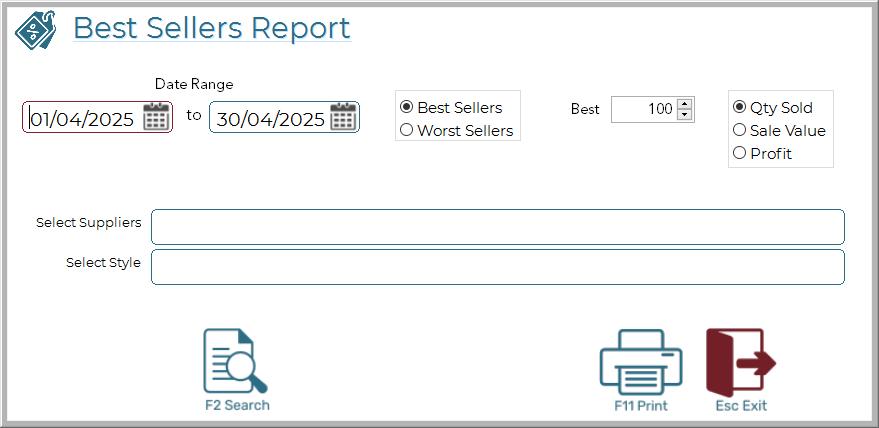
🗓 Date Range
From / To: Set the start and end dates for the sales period you want to analyse.
🔍 Report Type
Best Sellers: Shows the top-selling products during the period.
Worst Sellers: Shows products with the least sales activity.
🔢 Number of Products
Best: Enter how many products to include in the report (e.g., top 100).
📈 Metric Selection
Choose how you want to rank the products:
Qty Sold: Total units sold.
Sale Value: Total revenue generated.
Profit: Total gross profit earned.
🔄 Filters
Select Suppliers: Limit the report to products from specific suppliers.
Select Style: Filter results by product style or category if applicable.
📌 Notes
The system pulls data from completed sales only.
"Worst Sellers" will exclude products with zero sales during the selected range, returns are also excluded.
Profit calculations are based on the average cost at the time of the sale.