Stock Sales Matrix
Stock Sales Matrix
The Stock Sales Matrix screen provides a detailed month-by-month breakdown of stock sales across a 13-month period ending on a user-specified date. It includes powerful filtering options by Attributes and Suppliers, and calculates stock turn to help identify how efficiently stock is moving.
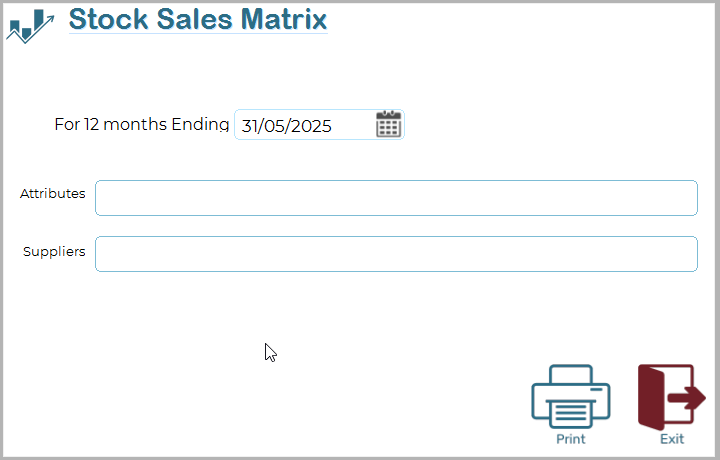
End Date Selection:
Set the final month of the 12-month reporting period using the calendar picker.
Attribute Filter (optional):
Select one or more attribute tags to limit the report to stock items matching any of the selected tags (across any of the 10 attribute fields).
Supplier Filter (optional):
Choose one or more suppliers to restrict the report to items from those suppliers.
Date Range Logic
The system automatically selects a 13-month period ending on the date selected.
Report Calculations
Monthly Sales:
Each item's sales are grouped by month across the 12-month window.
Stock Turn:
Calculated for each item using:
Stock Turn=Total Units SoldAverage Stock on Hand\text{Stock Turn} = \{Total Units Sold}}{\text{Average Stock on Hand}}Stock Turn=Average Stock on HandTotal Units Sold
Where:
Total Units Sold is the sum of QTY over the 12-month period.
Average Stock on Hand is derived from the average of qty onhand at the time of each sale.

💡 Tips
Use the attribute filter to focus on product categories like Wine, Cleaning, or Snacks.
Use the supplier filter to review performance of specific vendors.
A high stock turn indicates fast-moving items; a low stock turn may suggest overstock or slow sales.