BestSellers / WorstSellers
Ramsys Best/Worst Sellers Report
The Bestsellers Report provides a powerful summary of your best and worst-performing stock items over a selected date range. This report ranks items based on quantity sold, sales value, or profit generated, allowing you to make informed merchandising, pricing, and inventory decisions.
It can also be filtered by supplier, stock attributes, and stock on hand, giving you flexibility to focus on the data that matters most.
Navigate to the [Stock] > [Reports] > Bestsellers screen.
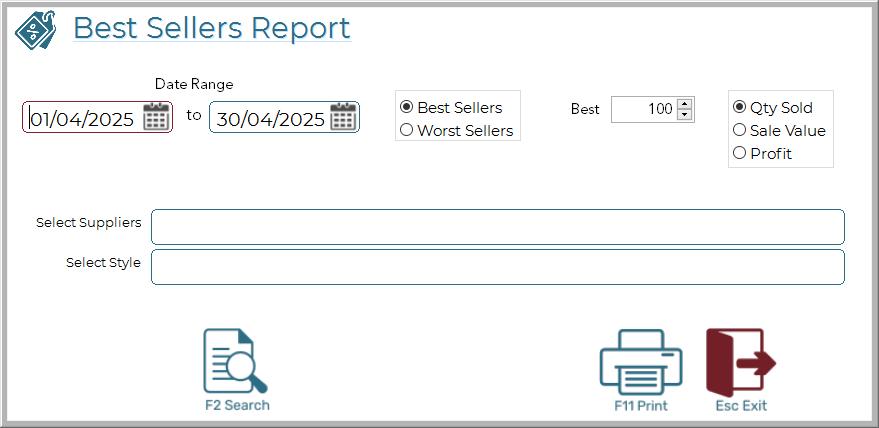
Report Parameters
|
Field |
Description |
|
Date Range |
Defines the start and end date for the reporting period. |
|
Rank Type |
Choose between Best (top sellers) or Worst (bottom performers). |
|
Limit |
Number of items to return (e.g., Top 50, Bottom 100). |
|
Ranking Method |
Select how to rank the items: • Quantity Sold • Sale Value • Profit |
|
Supplier Filter (Optional) |
Restrict report to specific suppliers. |
|
Attribute Filter (Optional) |
Restrict report to items with matching attribute tags (e.g., brand, gender, size). |
|
Only Show Items in Stock (Optional) |
Limits the report to items that currently have stock on hand. |
Report Output
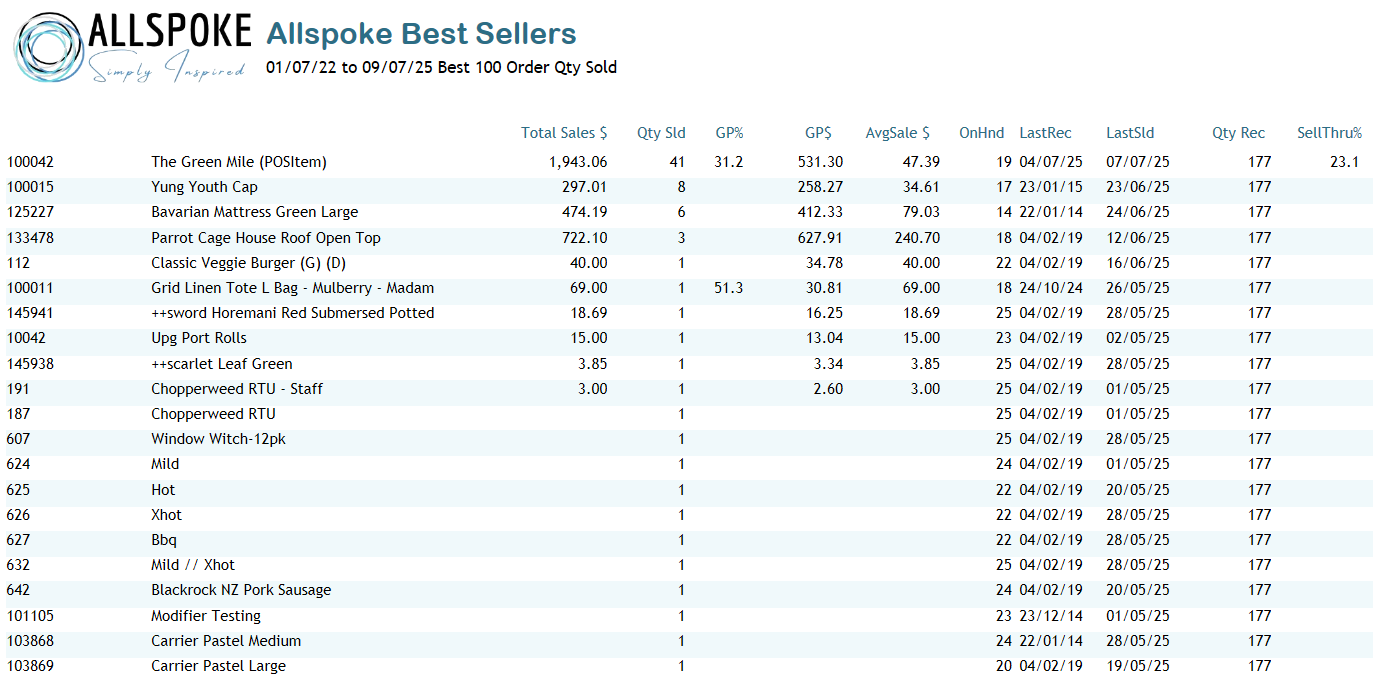
Each item in the report includes the following fields:
|
Field |
Description |
|
RankType |
Indicates whether this is a Best or Worst sellers report. |
|
Item Code (ISC Code) |
Unique stock code used within Ramsys. |
|
Description |
Full product description. |
|
Qty On Hand |
Current quantity on hand in stock. |
|
Sale Value |
Retail price (GST inclusive or exclusive depending on settings). |
|
Last Sold |
Date this item was last sold. |
|
Last Received |
Date this item was last received into stock. |
|
Quantity Sold |
Total number of units sold in the selected period. |
|
Total Sales Value |
Sum of sale values for the item during the period. |
|
GP$ (Total Profit) |
Calculated as Sale Value – Tax – Cost per unit, multiplied by quantity. |
|
Qty Rec (Total Received) |
Quantity received into stock during the date range. |
|
Sell Through |
A measure of how many times the item has sold through in the selected period, relative to stock received. See explanation below. |
What is Sell Through?
Sell through in Ramsys measures the efficiency of stock movement over the selected date range. It is calculated using the formula:
Stock Turn = (Total Quantity Sold / Total Quantity Received) × 100
This gives a percentage indicating how much of the received stock has been sold during the period.
Example
If 80 units were sold and 100 units received during the period:
Sell Through = (80 / 100) × 100 = 80%
This means 80% of the received stock has been sold — a sign of healthy turnover.
Why It Matters
- A higher Sell through % indicates faster-moving inventory — ideal for cash flow and space efficiency.
- A lower Sell through % may suggest overstocking or poor product performance.
This metric helps:
- Evaluate how well you're managing incoming stock
- Identify products that are moving too slowly (or too fast to maintain stock levels)
- Fine-tune purchasing and promotion strategies
Note: Items with zero received quantity will have no Sell through value, as division by 0 is not possible.
Use Cases
- Identify top-selling products to prioritise for reordering or promotion.
- Detect under-performing products for review, discounting, or clearance.
- Compare supplier performance by filtering report by supplier.
- Run attribute-based analysis to track performance by style, brand, size, etc.
- Generate boardroom-ready reports with quick export to PDF or Excel.
Tips
- Use the "Only Show Items in Stock" option to exclude discontinued or archived items.
- Combine Supplier and Attribute Filters for targeted analysis (e.g., "Top-selling women’s Nike shoes from Supplier X").
- Adjust the Limit to get broader or tighter summaries (e.g., Top 10 vs Top 500).