Dashboard
Sales Dashboard Overview
The Sales Dashboard provides a comprehensive, real-time view of your store’s performance, allowing managers and staff to monitor key metrics, identify trends, and make informed decisions.
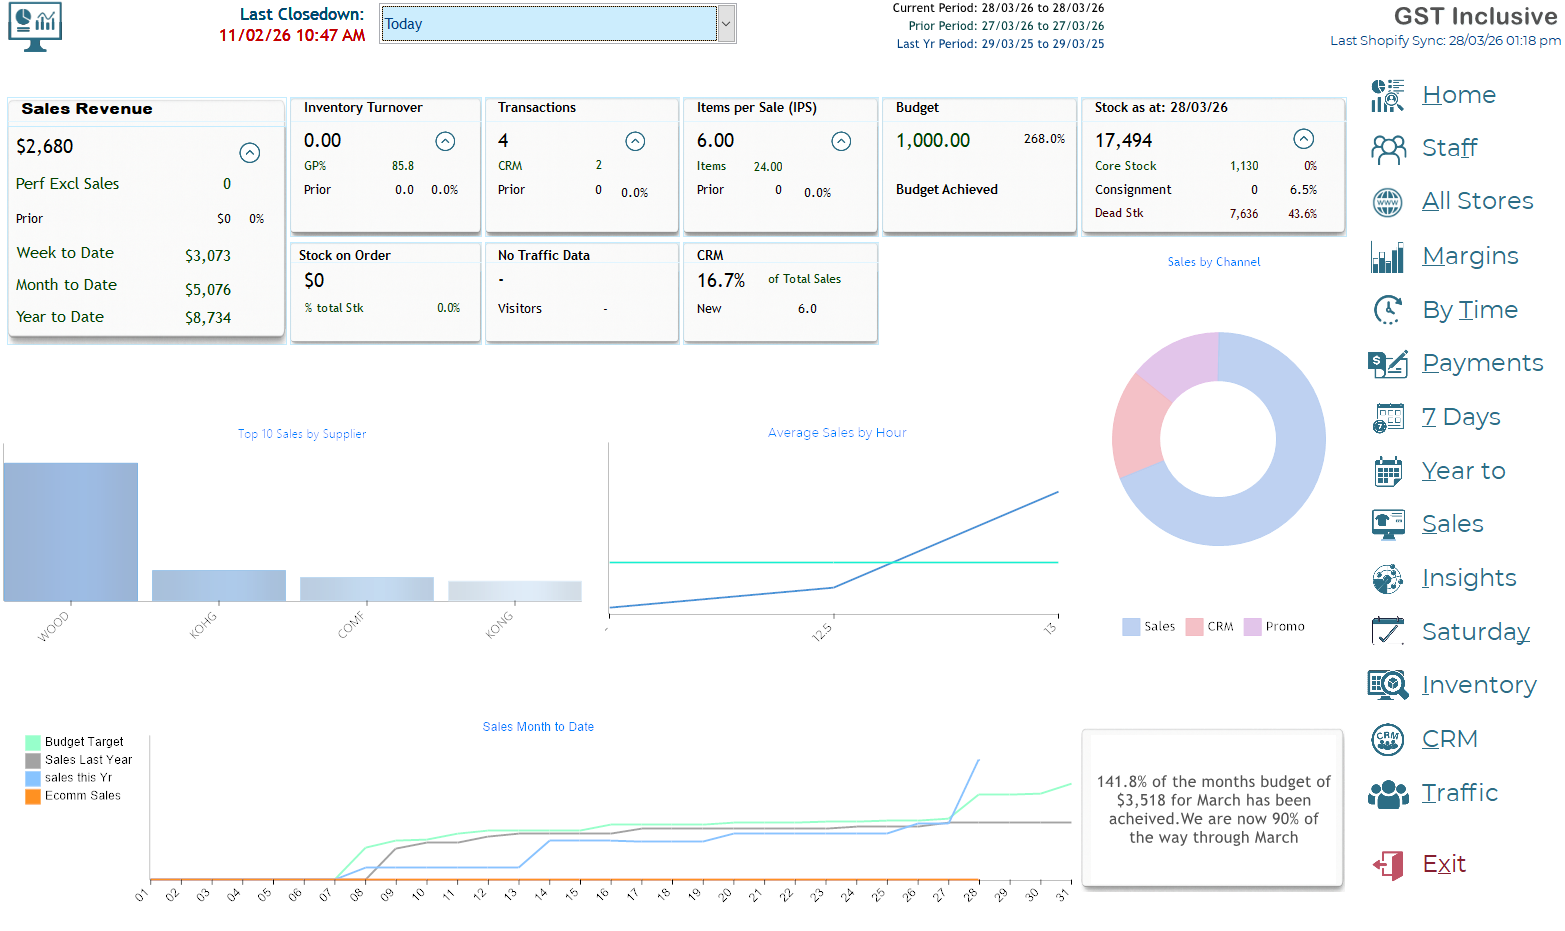
By default the date range is the current day, you may however select any date range using the date boxes in the top bar. click refresh to refresh the data for the selected range.
Header Information
- Last Closedown: Displays the last day and time the system was closed out.
- Current Period: Shows the date range for the current reporting period.
- Prior Period / Last Year Period: Compare performance against the previous period or the same period last year.
Key Performance Indicators (KPIs)
The top section displays essential metrics for the selected period:
|
Metric |
Description |
|
Sales Revenue Current Period |
Total sales revenue for the selected period, GST inclusive. |
|
Inventory Turnover |
Measures how efficiently stock is sold and replenished. |
|
Transactions |
Number of sales transactions processed. |
|
Items per Sale (IPS) |
Average number of items sold per transaction. |
|
Total Stock Value |
Current value of stock on hand, split between core stock and consignment. |
Additional Indicators:
- Perf Excel Sales / GP% Prior: Compare current performance against prior period targets.
- Below Min: Highlights any Sales made below the minimum Retail price.
Staff-Level Stats
The table below KPIs breaks performance down by user:
- Sales / GP% / Qty / Trans / IPS: Individual sales, gross profit, quantity sold, number of transactions, and items per sale for each user.
- Return Stats: Average sale, return value, return transactions, and IPS transactions for returns.
-
Summary Tiles
- Week to Date / Year to Date Sales: Quick view of cumulative sales.
- Stock on Order / No Traffic Data: Displays current stock on order and visitor statistics.
- Last Year Comparison: Shows sales for the same day or period last year.
- New CRM Members: Tracks new customer sign-ups and percentage change.
Charts
- Top 10 Sales by Supplier: A bar chart showing the highest performing suppliers.
- Average Sales by Hour: Line graph illustrating hourly sales trends.
- Sales Month to Date: Trend line comparing Budget Target, Sales Last Year, Sales This Year, and E-commerce sales.
Charts help identify peak periods, supplier performance, and trends over time.
Navigation Panel
The right-hand panel provides quick access to other screens and functions:
- Home, All Stores, Margins, By Time, Payments, 7 Days, Yr to Date, Sales, Insights, Friday, Inventory, CRM, Traffic, Refresh, Exit
- Click Refresh to update the dashboard with the latest data.
Tips:
- Hover over charts for detailed metrics.
- Use the period selector to view data for Month to Date, Week to Date, or custom date ranges.