All Stores
All Stores
(Enterprise Edition only)
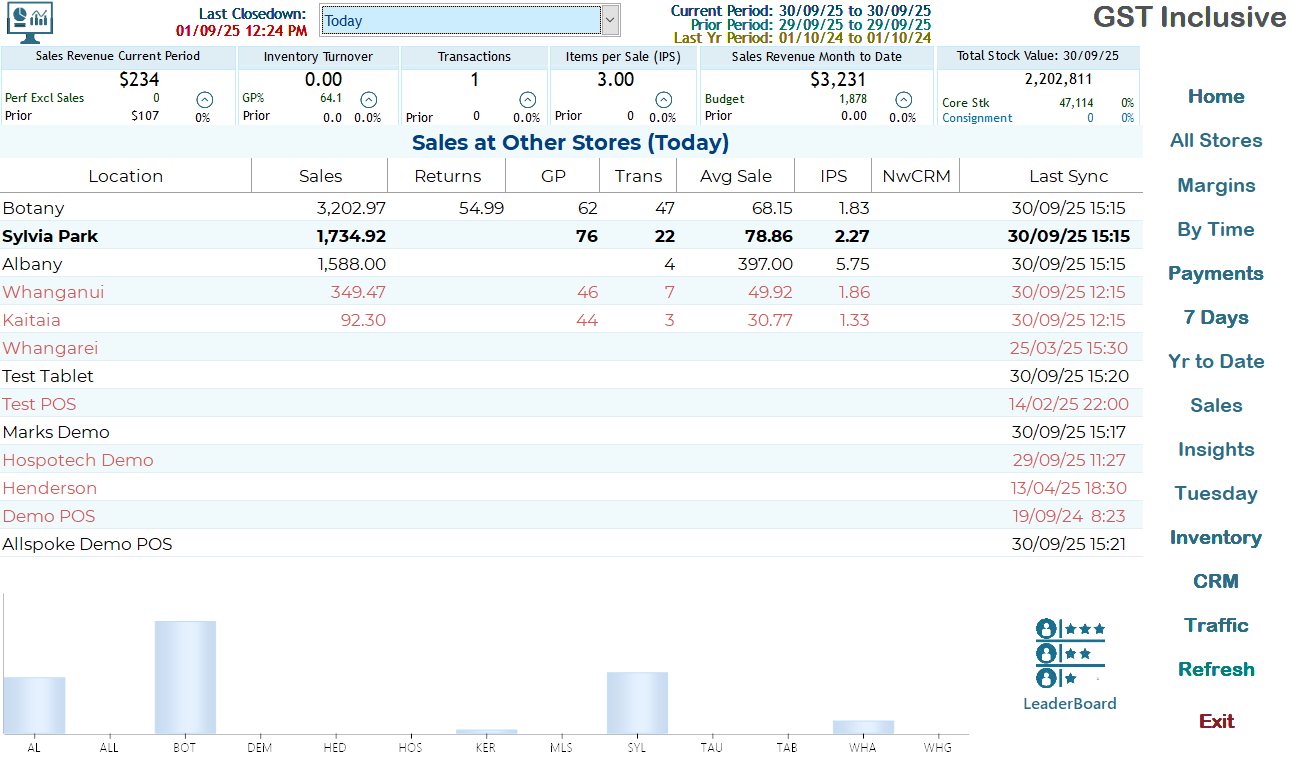
The Sales at Other Stores screen provides a quick overview of how your local store is performing compared to other stores in your network. This allows managers and staff to compare their performance and sales trends, identify high-performing locations, and detect potential issues in real time.
Layout and Columns
The main table displays each store with the following columns:
- Location – Name of the store. Your local store is highlighted in bold to make it easy to identify.
- Sales – Total sales value for the current day.
- Returns – Number of items returned today.
- GP – Gross profit for the day.
- Trans – Number of transactions processed.
- Avg Sale – Average sale value per transaction.
- IPS – Items per sale, giving insight into customer purchasing behaviour.
- Last Sync – The date and time when the data was last updated for this location.
Stores that are inactive or demonstration accounts appear in lighter or red text to distinguish them from active stores.
Graphical Representation
Below the table, a simple bar chart visually represents the sales performance of each store. This provides a quick visual comparison, making it easy to see which stores are performing above or below average.
Each bar corresponds to a store, with the height representing the total sales for that day. Your local store is highlighted in the dashboard to allow immediate recognition of performance relative to others.
Leader Board
The Leader board page presents a comprehensive view of sales performance metrics for the local store. It enables users to assess their performance in comparison to other stores and company averages, showcasing key performance indicators (KPIs) effectively
Usage
- Compare Performance: Instantly see how your store stacks up against others in sales, transactions, and average sale value.
- Identify Trends: Quickly identify stores with high returns or unusually low performance.
- Monitor Synchronisation: The “Last Sync” column ensures you are viewing up-to-date data.
This screen is designed to give managers and staff a real-time snapshot of sales activity across multiple locations, supporting informed decisions for staffing, promotions, and inventory management.