7 Days
7 Days
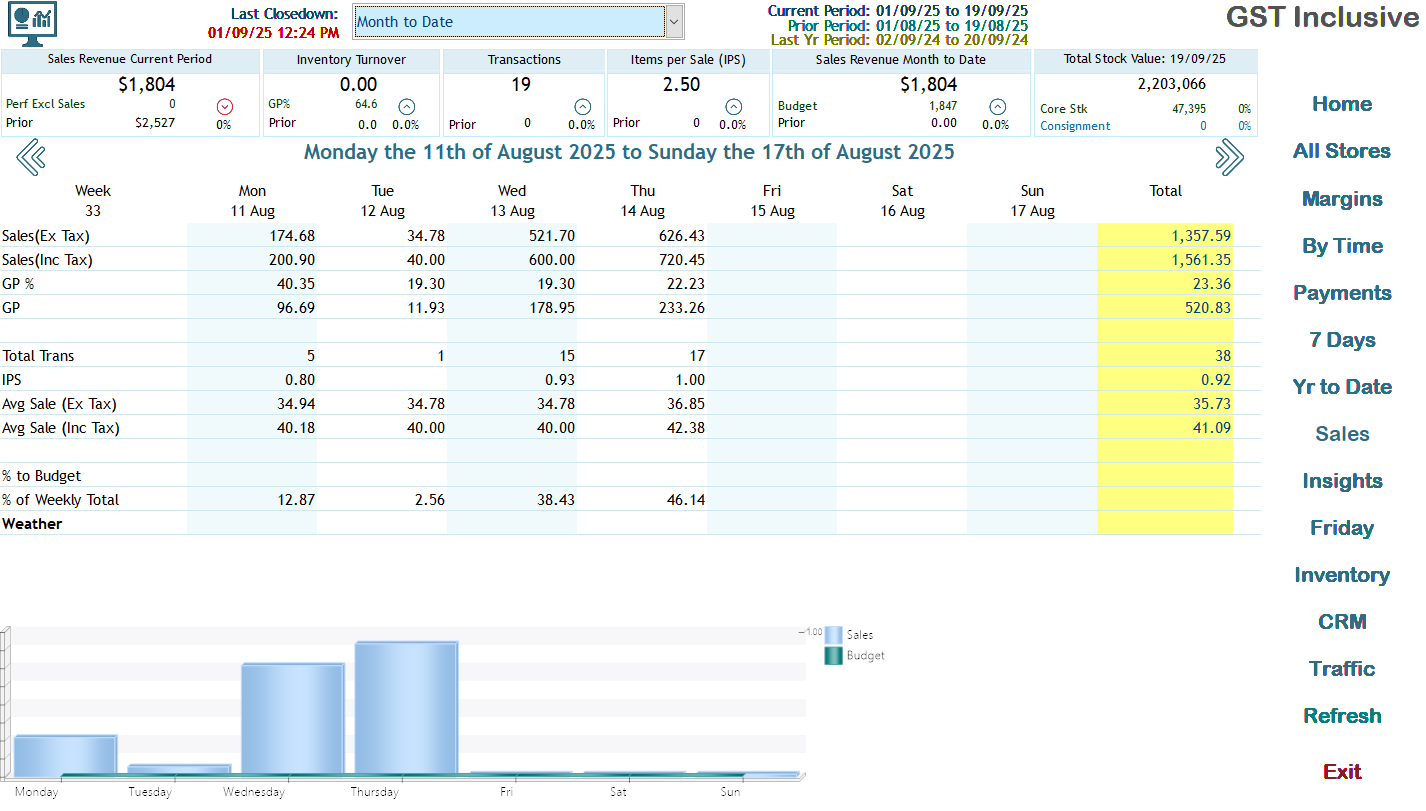
This screen presents comprehensive sales and customer data for the week. It includes daily sales metrics, gross profit (GP), total customers, and a visualisation of performance trends, ensuring effective analysis for decision-making.
Data Overview
- Weekly Sales Summary: Provides insights into sales figures excluding tax, including total sales for the week.
- Total Sales (Ex Tax): Shows The same value excl of tax (GST)
- Total Customers: Counts customers engaging during the week, indicating customer retention and outreach effectiveness.
Daily Metrics
- Sales Breakdown: Each day’s sales (Ex Tax and Inc Tax) are detailed alongside gross profit.
- Average Sales Per Day:
- Displays average sales calculations, helping assess daily performance trends.
Totals and Averages
- Weekly Totals: Summaries of total sales and average sales metrics are provided, delivering insights into overall performance.
- % to Budget: The percentage of sales achieved compared to the budgeted forecast, crucial for financial assessment.
Graphical Trends
- Sales Trend Graph: A line chart illustrating sales trends throughout the week, visually indicating peaks on specific days. This visualization assists in quickly identifying daily sales performance against budgeted targets.
Promotional Campaigns
- Information on promotions for the week. Insights into its impact on sales can enhance future campaign strategies.
Usage Tips
- Regularly monitor this screen to understand daily sales dynamics and adjust promotional strategies accordingly.
- Use the trends visual to assess the effectiveness of marketing campaigns, allowing for data-driven decisions.
- Apply insights from daily metrics to identify slow sales days, focusing on potential areas for improvement.
- Use the left and right arrows to advance to next or previous weeks.