Performance
Customer Master – Performance Tab
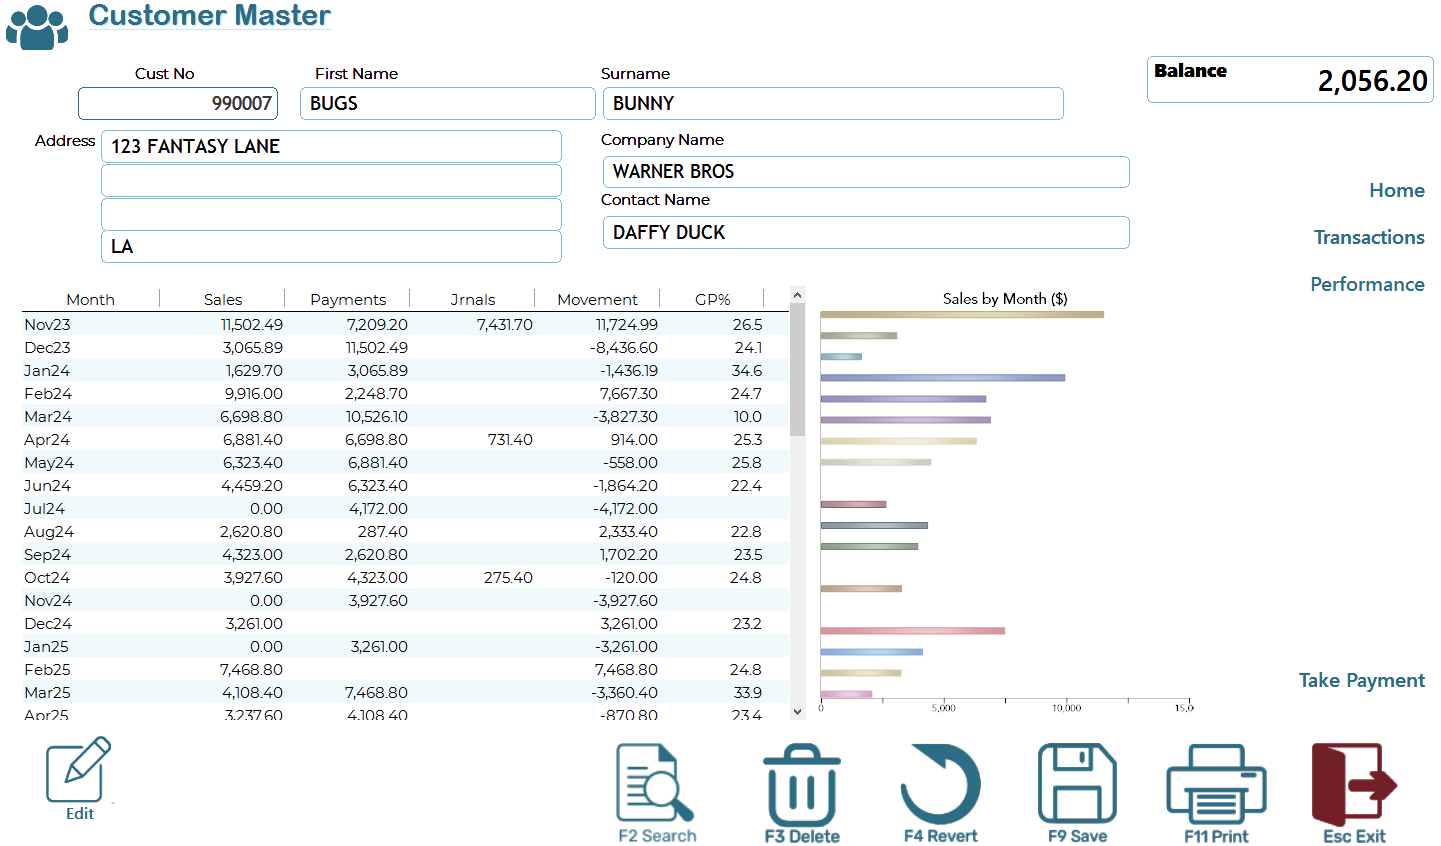
The Performance tab provides a monthly breakdown of the customer’s account activity. It helps you assess customer engagement, buying patterns, payment behaviour, and profitability over time.
This view is particularly useful for account and layby customers, where credit and journal entries are common and payment tracking is essential.
Screen Overview
|
Column |
Description |
|
Month |
The month/year of the transactions (e.g., "Feb24") |
|
Sales |
Total sales (in dollars) made to the customer during that month |
|
Payments |
Total payments received from the customer |
|
Journals |
Journals applied to the customer’s account (e.g., adjustments, write-offs) |
|
Movement |
Net movement in account balance for the month, including sales, payments, and journals |
|
GP% |
Gross Profit percentage = (Sales - Cost) / Sales * 100. Indicates margin health |
Bar Chart – Sales by Month
The Sales by Month ($) chart visualises customer spending over time.
Each bar represents the total sales value for a month.
This visual trend helps quickly identify:
Peaks and lulls in buying activity
Seasonal patterns
Drop-off in engagement
How It’s Used
Review monthly trends when doing account reviews or credit limit evaluations
Identify inconsistent payments or periods of high outstanding balances
Spot profitable vs. unprofitable months using the GP% column
Cross-reference low payments or high journals to evaluate credit risk
Support your sales and marketing decisions by targeting months of inactivity
Tips
Use this data when preparing range reviews or customer profitability reports
Periods with high movement but low payment may indicate risk or dispute
Months with 0.00 sales could indicate inactivity, credit hold, or account dormancy