Store/Premium Central Menu
Store Level / Premium Central Main Menu
The Store Level screen provides a detailed overview of an individual store's performance and key metrics. For businesses operating multiple stores, simply double-click on any store from the main company overview screen to open this page. For single-store operations, this screen is displayed by default when entering Ramsys Central.
This dashboard gives management an immediate snapshot of sales performance, transaction activity, and comparative statistics for the selected store.
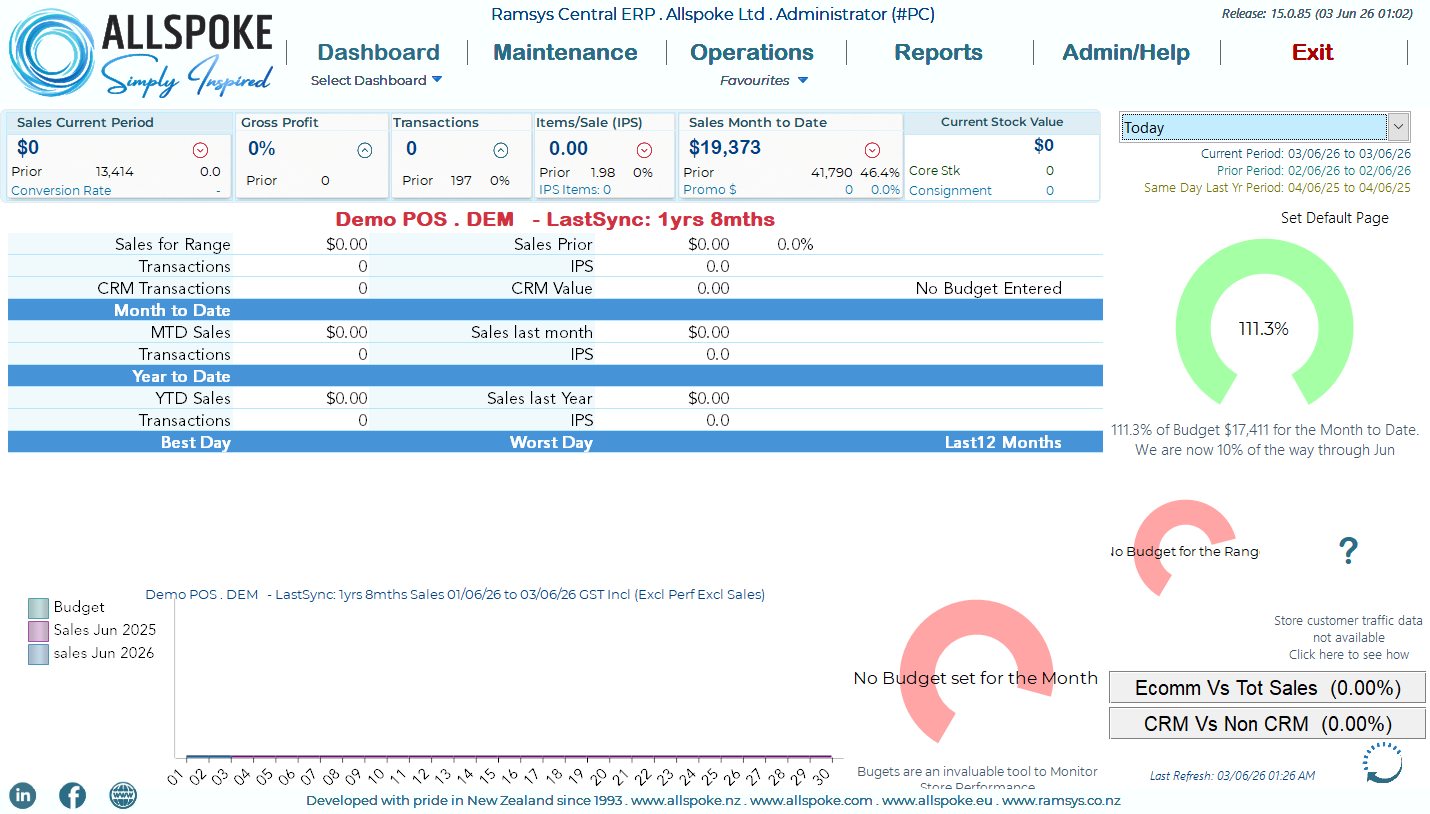
The dashboard is divided into several performance sections:
Sales for Range
Displays sales information for the currently selected reporting period.
- Sales for Range – Total sales value generated during the selected date range.
- Transactions – Number of completed sales transactions.
- IPS (Items Per Sale) – Average number of items sold per transaction.
- Sales Prior – Sales achieved during the equivalent previous period.
- CRM Transactions – Number of sales linked to customer records.
- CRM Value – Total sales value associated with CRM customers.
Month to Date (MTD)
Shows store performance from the beginning of the current month up to today.
- MTD Sales – Total sales achieved this month.
- Transactions – Number of transactions completed this month.
- IPS – Average items per sale for the month.
- Sales Last Month – Sales achieved during the equivalent period last month.
Year to Date (YTD)
Provides a summary of performance from the start of the financial or calendar year to the current date.
- YTD Sales – Total sales achieved year to date.
- Transactions – Total number of sales transactions year to date.
- IPS – Average items per sale for the year.
- Sales Last Year – Comparative sales figure from the previous year.
Best Day
Displays the highest-performing trading day within the selected reporting period.
Worst Day
Displays the lowest-performing trading day within the selected reporting period.
Last 12 Months
Provides a rolling twelve-month view of store performance, allowing management to identify trends and seasonal patterns.
Using This Screen
The Store Level dashboard is designed to provide management with quick access to key performance indicators (KPIs) without requiring detailed reporting. It is particularly useful for:
- Comparing current performance against previous periods.
- Monitoring customer engagement through CRM sales activity.
- Identifying sales trends and seasonal fluctuations.
- Measuring transaction volumes and average basket size.
- Comparing the performance of multiple stores within the same company.
By reviewing this screen regularly, managers can quickly identify opportunities for improvement and respond to performance changes as they occur.