Ecommerce Dashboard
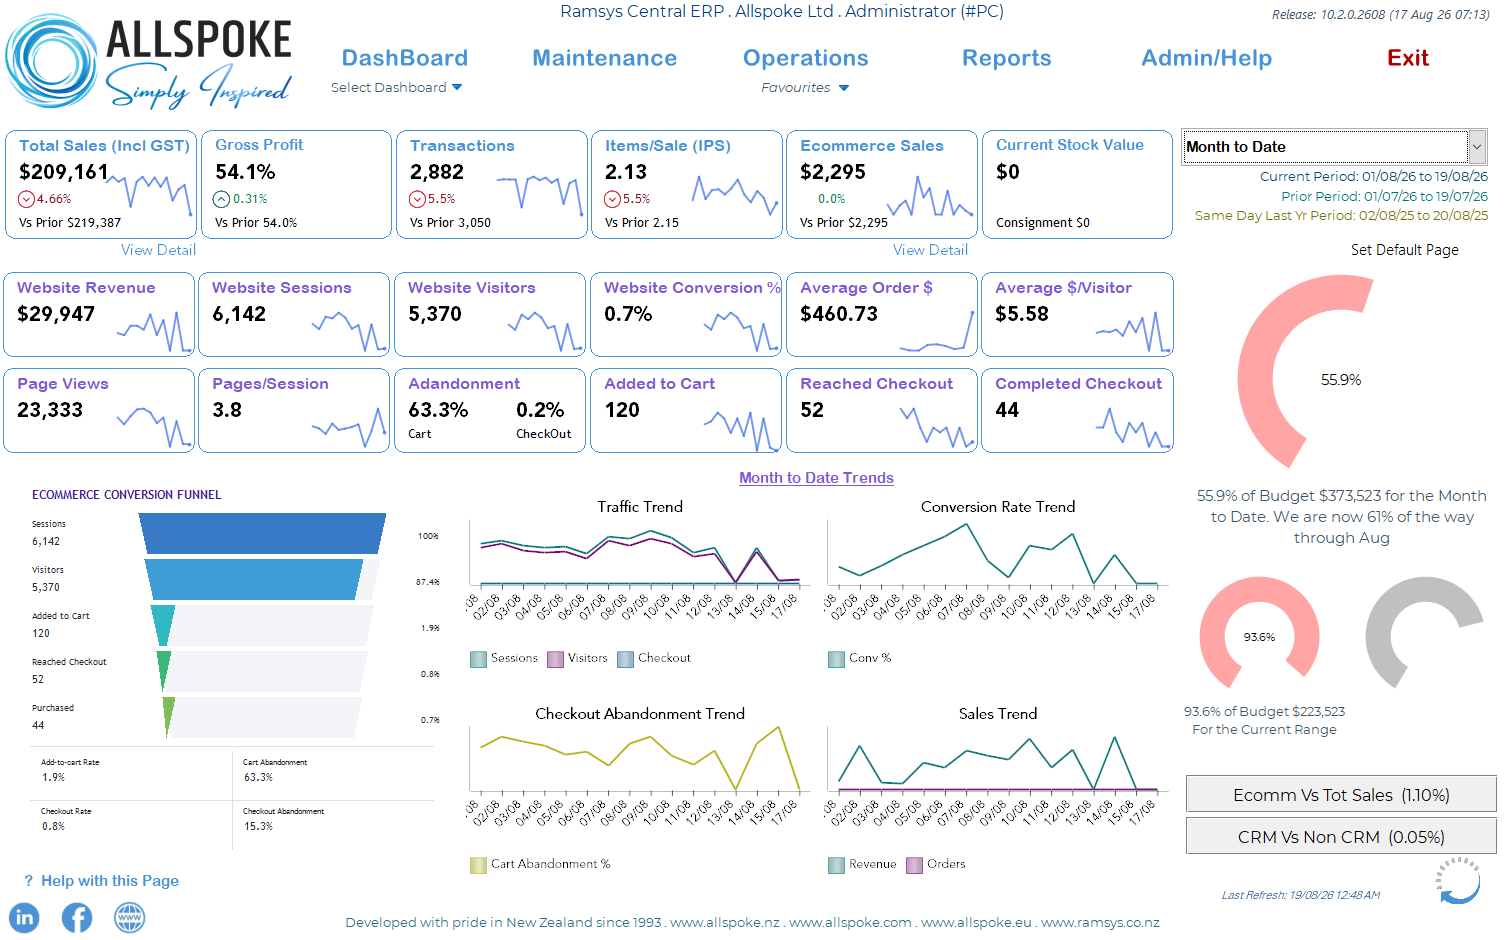
The Ecommerce Dashboard gives you a single view of how your website is performing, not just how much it is selling.
A website can have strong sales one month and weaker sales the next for very different reasons. Perhaps fewer people visited the site, perhaps visitors did not add products to their cart, or perhaps customers reached checkout but did not complete their purchase. This dashboard helps identify where the opportunity or problem is.
Understanding where the information comes from
It is important to understand that this dashboard combines information from Ramsys and Shopify.
Many of the website statistics — including Sessions, Visitors, Page Views, Added to Cart, Reached Checkout, Completed Checkout, Conversion and Website Revenue — are retrieved directly from Shopify reporting. They are displayed in Ramsys so that you can analyse your physical and ecommerce business together, but these figures are not calculated from the Ramsys sales database.
The Shopify figures are therefore a current view of activity Shopify has recorded for your website.
There is an important distinction between Website Revenue and Ecommerce Sales elsewhere in Ramsys:
- Website Revenue is the revenue Shopify reports for the selected period. It reflects what has happened on your website according to Shopify.
- Ecommerce Sales represents ecommerce orders that have been downloaded and processed into Ramsys.
Normally these figures should be reasonably close, but they do not necessarily match at every point in time. For example, if several new Shopify orders are waiting to be downloaded or processed in Ramsys, Shopify's Website Revenue will be ahead of Ramsys Ecommerce Sales. How closely the two figures match therefore depends partly on how up to date the ecommerce order processing is.
A difference between the two figures does not automatically indicate an error.
Start at the top: the headline numbers
The cards across the top provide a quick health check.
Website Revenue tells you the value Shopify reports as generated by the website for the selected period.
Website Sessions is the number of visits to the website. Think of this as your website's equivalent of foot traffic through the shop door. One person can generate more than one session.
Website Visitors is the number of individual visitors. Comparing Visitors with Sessions helps indicate how often people are returning.
Website Conversion % is the percentage of sessions that resulted in a completed checkout. This is one of the most useful measures of ecommerce performance.
Average Order $ tells you the average value of a completed website order.
Average $/Visitor looks at revenue from a different perspective: how much revenue is being generated for each website visitor.
The second row then shows engagement with the website:
Page Views tells you how many pages visitors viewed.
Pages/Session shows how deeply people are browsing. A very low number can indicate visitors are arriving but not exploring the site.
Abandonment highlights customers who start the purchasing process but don't finish it.
Added to Cart, Reached Checkout and Completed Checkout show the progressively smaller number of visitors moving towards a purchase.
The small trend lines on the cards are particularly useful. Don't look only at today's number — look at whether the KPI is improving, stable or deteriorating.
The Conversion Funnel — where are you losing customers?
The funnel is one of the most useful parts of the dashboard.
It follows customers through:
Sessions → Visitors → Added to Cart → Reached Checkout → Purchased
Think of it as following people from entering your store through to reaching the till and paying.
The objective isn't to get 100% of visitors through every stage — that would be unrealistic. Instead, use the funnel to identify where an unusual number of people are dropping out.
For example, imagine you have plenty of Sessions and Visitors but very few Added to Cart. Traffic itself may not be your main problem. Instead, investigate things such as product range, pricing, photography, descriptions, availability, navigation and whether visitors are finding what they expected when they arrived.
If plenty of customers Add to Cart, but relatively few Reach Checkout, investigate the cart experience. Unexpected freight costs, unclear delivery information, difficult navigation or customers simply using their cart as a wishlist can all contribute.
If customers Reach Checkout but don't Purchase, concentrate on the checkout experience. Payment options, freight charges, delivery times, checkout complexity and customer confidence are areas worth investigating.
The funnel therefore helps answer a much better question than simply:
“Why aren't website sales higher?”
It helps you ask:
“At what point are we losing the customer?”
That is a much more actionable question.
Abandonment isn't necessarily bad
Don't panic simply because an abandonment percentage looks high.
Online customers behave differently from customers standing at a physical checkout. They compare products, return later, use carts to remember products and can shop across several websites before deciding.
What matters most is the trend and any significant change.
For example, if Cart Abandonment has normally been around 60–65% and suddenly rises sharply, ask what changed. Did freight charges change? Did a promotion finish? Is an important payment method unavailable? Are popular products out of stock?
A sudden change is often more useful than the absolute percentage itself.
Use the trend graphs
The graphs on the right show how important measures have moved through the selected period.
Traffic Trend compares Sessions and Visitors. If sales fall and traffic has also fallen, the first problem may be attracting people to the website rather than converting them.
Conversion Rate Trend separates traffic from effectiveness. If traffic is stable but conversion falls, investigate what happens after visitors arrive.
Checkout Abandonment Trend helps identify changes in the final stages of purchasing.
Sales Trend lets you compare revenue and order activity. This helps distinguish between changes caused by the number of orders and those caused by customers spending more or less per order.
Don't overreact to a single day's movement. Look for sustained changes and patterns.
Turning the dashboard into action
A useful way to approach the dashboard is:
|
What you see |
Where to investigate |
|
Sessions falling |
Marketing, advertising, email campaigns, SEO, social activity |
|
Visitors strong but Add to Cart weak |
Products, pricing, imagery, descriptions, navigation, stock availability |
|
Add to Cart strong but Checkout weak |
Cart experience, freight information, delivery expectations |
|
Checkout strong but Purchases weak |
Checkout process, payment methods, freight cost, customer confidence |
|
Conversion falling while traffic is stable |
Website/product/checkout experience |
|
Orders stable but revenue falling |
Average order value, product mix, promotions |
|
Revenue growing faster than orders |
Customers are spending more per order |
|
Pages/Session falling sharply |
Landing pages, navigation, traffic quality |
|
Shopify Website Revenue ahead of Ecommerce Sales |
Check that recent ecommerce orders have been downloaded and processed in Ramsys |
Don't judge ecommerce from one number
The most important principle is not to optimise one KPI in isolation.
A marketing campaign could dramatically increase Sessions while reducing Conversion %, simply because it brought a much larger and less committed audience to the site. That campaign could still increase total orders and revenue.
Similarly, a high Conversion % from very little traffic isn't necessarily a successful website.
Look at the relationship between:
Traffic → Engagement → Conversion → Orders → Revenue
The dashboard is designed to let you see that complete journey.
A simple weekly routine
Spend a few minutes reviewing the dashboard each week. Compare the current period with what is normal for your business and ask three questions:
Are enough people arriving? Look at Sessions and Visitors.
Are they interested in what they find? Look at Page Views, Pages/Session and Added to Cart.
Are interested customers completing their purchase? Look at Reached Checkout, Purchased, Conversion and Abandonment.
Then concentrate your effort on the stage showing the greatest opportunity.
The purpose of the Ecommerce Dashboard isn't simply to produce more statistics. It is to help you understand what customers are doing between arriving at your website and becoming a sale — and therefore where your next ecommerce improvement is most likely to make a difference.
Important – Shopify Reporting Permission
The Ecommerce Dashboard requires Ramsys to have permission to access Shopify's reporting information.
If this permission has not been enabled, Ramsys will not be able to download website statistics such as Sessions, Visitors, Page Views and Conversion information.
If you see a Shopify Reporting Permission Required message, please contact your Shopify support provider. This is a Shopify access setting and does not indicate a problem with your sales data or Ramsys.
Note: Shopify reporting permissions may need to be approved or updated when the Ramsys Shopify integration is first installed or when Shopify access permissions are changed.
Shopify Permissions required for this are
read_reports API scope — gives the app access to Shopify analytics/reporting data.
Level 2 Protected Customer Data access, specifically including:
- Name
- Address
- Phone