Sales Dashboard
Sales Dashboard
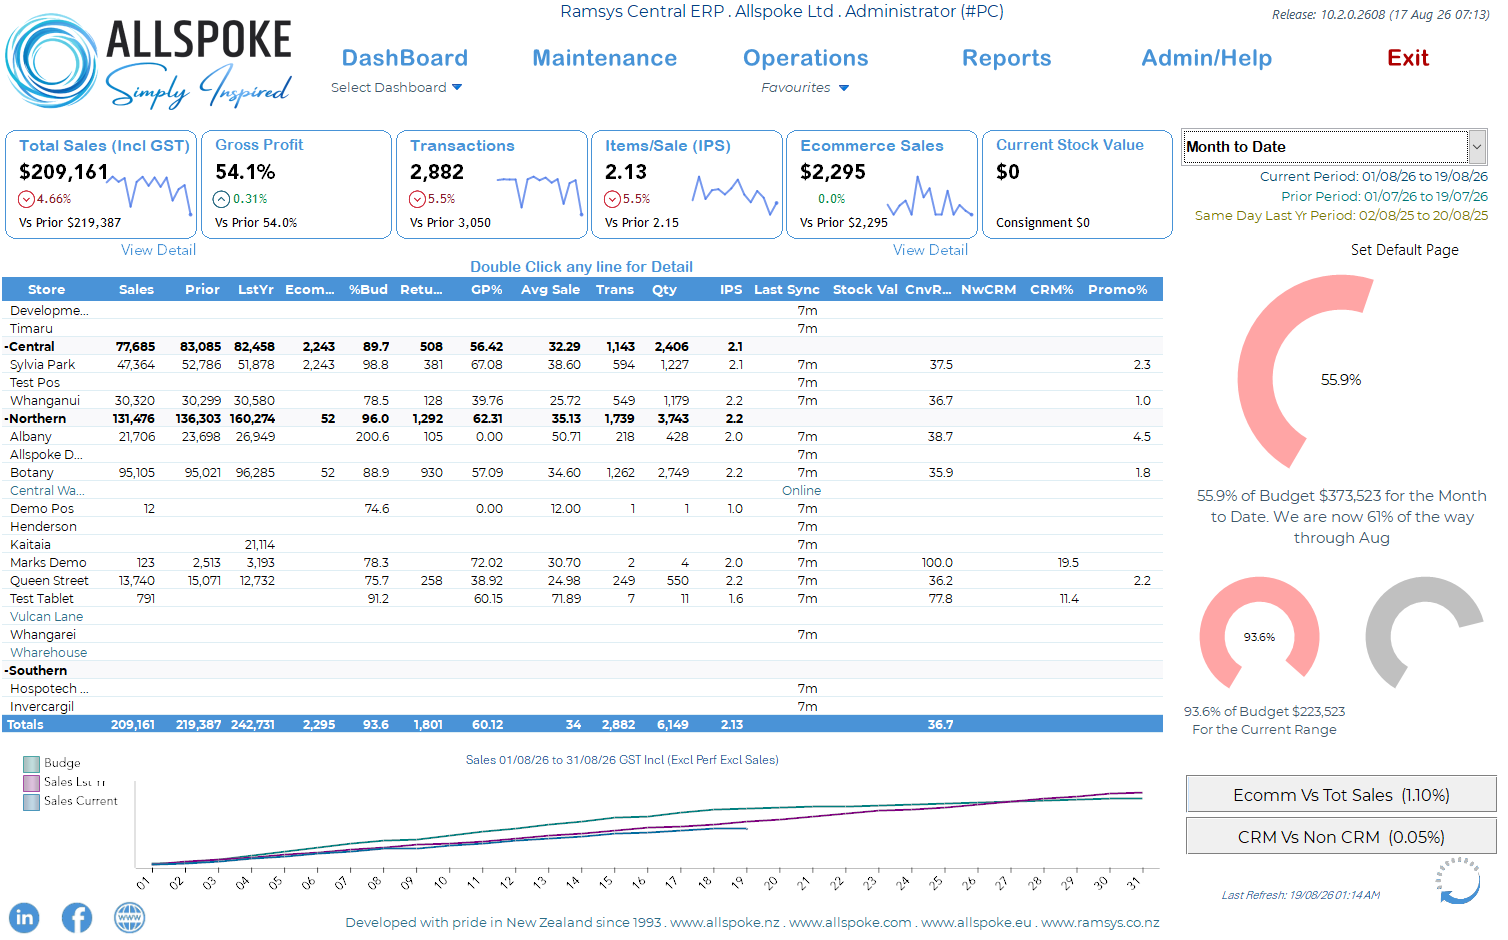
Selecting the period
Use the period selector at the top right to choose the reporting period, such as Month to Date.
Ramsys displays the dates being compared:
Current Period — the period being analysed.
Prior Period — the equivalent preceding period.
Same Day Last Yr Period — the comparable period last year, aligned to the same trading days where appropriate.
This is important when reading the dashboard. A sales figure on its own tells you what happened; comparison with prior periods tells you whether performance has improved or deteriorated.
Headline KPIs
The cards across the top provide an immediate snapshot of the business.
Total Sales (Incl GST) is total retail sales for the selected period. The percentage movement and prior-period value underneath provide context, while the sparkline shows the trend through the period.
Gross Profit shows the gross profit percentage being achieved. Increasing sales at the expense of margin isn't necessarily an improvement, so Sales and GP% should always be considered together.
Transactions is the number of completed sales. This is particularly useful for understanding why sales have changed.
For example, if sales are down 5% but transactions are down 12%, customers may actually be spending more when they buy. Conversely, stable transaction numbers with falling sales could indicate a reduction in average transaction value.
Items/Sale (IPS) is the average number of items purchased in each transaction. Improving IPS can be an effective way of increasing sales without needing additional customers.
Ecommerce Sales shows ecommerce sales that have been downloaded and processed into Ramsys. This is Ramsys transactional data and should not be confused with Shopify's Website Revenue displayed on the Ecommerce Dashboard.
Current Stock Value gives a high-level indication of the value of stock currently held.
The small trend lines (SparlLines) are there for a reason. A KPI's direction can often be more informative than the headline number itself.
Understanding the store table
The central table lets you compare individual stores and regions without opening separate reports.
Stores can be grouped into regions, with subtotals allowing management to compare both individual store performance and regional performance.
Depending on the information available, the table includes measures such as:
Sales — sales for the selected period.
Prior — sales for the comparable prior period.
Last Yr — comparable sales last year.
Ecomm — ecommerce sales attributed to the store or group.
%Bud — sales achieved as a percentage of budget.
Returns — returned merchandise.
GP% — gross profit percentage.
Avg Sale — average value of each transaction.
Trans — transaction count.
Qty — quantity of items sold.
IPS — items per sale.
Last Sync — how recently the store communicated with Ramsys Central.
Stock Val — current stock value where available.
Additional columns provide customer, conversion, CRM and promotional information where those facilities are in use.
Don't rank stores on sales alone
A larger store will naturally tend to sell more than a smaller one. The table becomes much more useful when you compare several measures together.
A store with lower sales but excellent GP%, Average Sale and IPS may actually be performing very effectively.
Likewise, a high-sales store with weak margin, low IPS or a high level of returns deserves investigation.
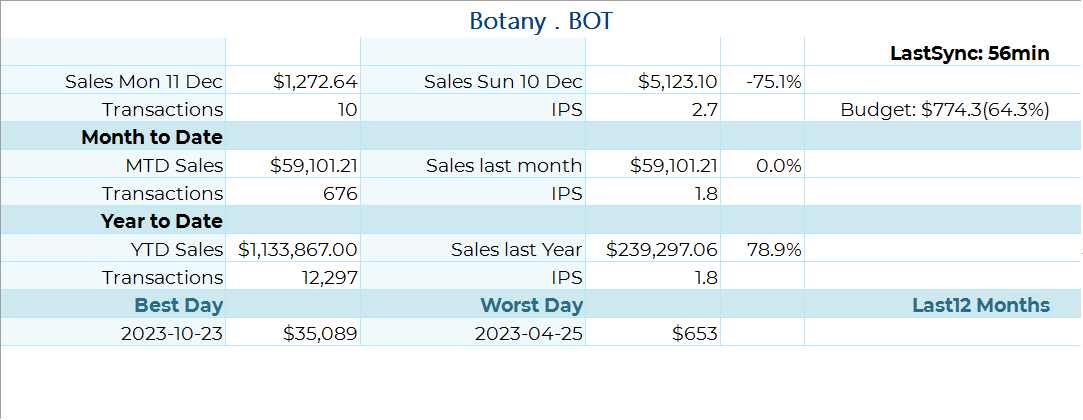
Store Detail
If you wish to see further detail on any store simply double click the desired store in the grid (G)
Understanding why sales changed
When sales move significantly, break the result into its components.
A useful starting point is:
Sales ≈ Transactions × Average Sale
Then Average Sale is influenced by factors including IPS, product mix and selling price.
For example:
Sales down + Transactions down
The first question is whether the store is seeing fewer customers or converting fewer opportunities.
Transactions stable + Average Sale down
Look at IPS, product mix, discounting and promotional activity.
Transactions down + Average Sale up
Fewer customers are buying, but those who do are spending more. The opportunity may therefore be traffic or conversion rather than basket building.
Sales up + GP% down
Check whether growth is being purchased through discounting or a lower-margin product mix.
This approach is far more useful than simply telling a store that it is “up” or “down”.
Budget performance
The gauges on the right provide a quick visual indication of performance against budget.
The large gauge shows Month-to-Date budget achievement, while the accompanying text also tells you how far through the month you currently are.
That comparison is important.
For example, being 55% of budget when only 40% of the month has elapsed is quite different from being 55% of budget when 80% of the month has elapsed.
The smaller gauge provides budget performance for the currently selected reporting range.
Budget should be treated as a management target, not simply a pass/fail number. Use it alongside prior-period and last-year performance to understand the result.
Sales trend
The graph across the bottom shows cumulative sales through the selected period and allows comparison with other relevant series such as Budget, Last Year and Current Sales.
Because the lines are cumulative, you can quickly see whether the business is:
gaining ground,
tracking consistently, or
falling progressively behind.
The shape of the line is often as useful as its final position.
If Current Sales starts below Last Year but gradually closes the gap, trading momentum is improving. If the lines progressively separate, investigate what changed.
Last Sync — an important health check
Before drawing conclusions from an individual store's figures, check Last Sync.
A recent sync indicates that Ramsys Central has received current information from that location. If a store has not synchronised recently, its sales or other figures may be incomplete.
An unusually old Last Sync time should therefore be investigated before assuming that the store itself is underperforming.