The Dashboard
Dashboard Overview
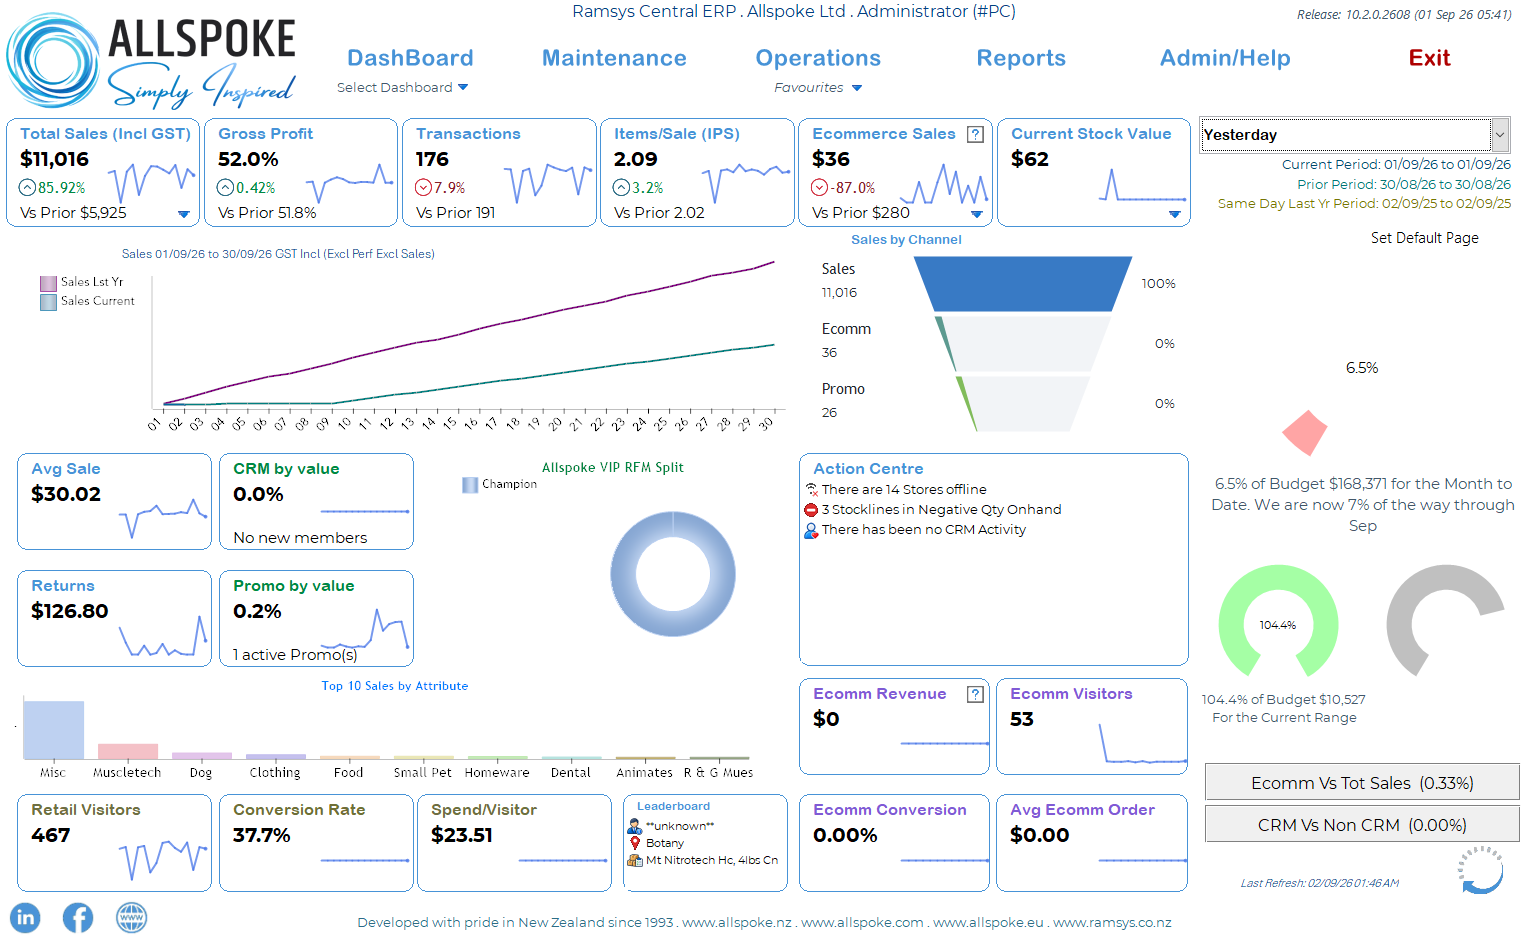
The Dashboard Overview provides a quick snapshot of the key areas of your business for the selected reporting period. It brings together sales, profitability, transactions, stock, customer activity, ecommerce and visitor information on a single screen.
Use the Select Dashboard option to move between available dashboards. The period selector at the top right controls the date range being displayed and shows the current, prior and corresponding previous-year periods used for comparison.
KPI Boxes
The KPI boxes across the dashboard display important measures such as Total Sales, Gross Profit, Transactions, Items per Sale (IPS), Ecommerce Sales and Current Stock Value.
Where applicable, each KPI also shows the percentage movement and the value for the comparison period. The small sparkline provides a quick indication of the trend over the selected period.
KPI boxes displaying a down arrow can be expanded. Click the arrow to open the detailed dashboard for that area. For example, the Sales KPI opens the detailed Sales Dashboard, while Current Stock Value opens the Stock Dashboard.
This allows the Overview to remain uncluttered while providing quick access to more detailed analysis when required.
Ecommerce Sales and Ecomm Revenue
The dashboard deliberately displays Ecommerce Sales and Ecomm Revenue separately. Although both relate to online trading, they come from different sources and should not be expected to always show the same value.
- Ecommerce Sales represents ecommerce orders that have been downloaded into Ramsys. Once downloaded, these transactions form part of Ramsys sales data and are included in the appropriate sales reporting and analysis.
- Ecomm Revenue is obtained directly from Shopify and represents ecommerce activity as reported by Shopify. It is independent of whether the corresponding orders have already been downloaded into Ramsys.
This distinction is useful when monitoring the ecommerce operation. For example, a Shopify order may contribute to Ecomm Revenue before it has been downloaded and processed by Ramsys, so the two figures can temporarily differ.
In simple terms:
Ecommerce Sales = orders currently recorded in Ramsys.
Ecomm Revenue = revenue currently reported by Shopify.
The two figures therefore provide different views of the same sales channel rather than being duplicate KPIs.
Sales and Channel Analysis
The main sales graph shows sales performance across the selected period and provides comparison with the corresponding prior period.
Sales by Channel shows how the total sales value is distributed between channels such as normal retail sales, ecommerce and promotions.
Additional KPI boxes provide measures including Average Sale, Returns, CRM Sales and Promotional Sales, while the attribute chart highlights the strongest-performing product attributes.
Customer and CRM
The CRM section shows the proportion of sales associated with recognised CRM customers.
The VIP RFM Split provides an overview of customer segmentation, helping identify groups such as higher-value or more engaged customers.
CRM measures are based on customers identified within Ramsys and are separate from general retail visitor statistics.
Retail Visitors and Conversion
Where visitor counting is available, the dashboard displays Retail Visitors, Conversion Rate and Spend per Visitor.
Conversion Rate measures the percentage of visitors who completed a transaction, while Spend per Visitor compares sales value against total visitor traffic. Together these provide useful context that cannot be obtained from sales figures alone.
Action Centre
The Action Centre draws attention to conditions that may require investigation, such as:
- stores that appear to be offline;
- stock items with negative quantities; and
- periods where no CRM activity has been recorded.
- total value of Dead Stock
These are intended as operational prompts. Select the appropriate item or detailed dashboard to investigate further.
Ecommerce Performance
The ecommerce section combines Shopify information with Ramsys ecommerce measures to provide a broader view of online performance.
Measures include Ecomm Revenue, Ecomm Visitors, Ecommerce Conversion and Average Ecommerce Order. These figures allow online traffic and conversion performance to be viewed alongside the ecommerce transactions that have reached Ramsys.
Remember that Shopify-derived figures and Ramsys Ecommerce Sales have different sources and may update at different times.
Budget Performance
Where budgets have been entered, the dashboard shows progress against the budget for the selected period and for the month to date.
These indicators provide an immediate view of whether sales are currently ahead of, on, or behind the expected level.
The Leaderboard
This is an easy way to identify the current top Salespers, location and Stock Item
Moving to Detailed Dashboards
The Overview is designed primarily for monitoring and navigation, rather than displaying every available measure.
Where a KPI box displays a down arrow, click it to open the corresponding detailed dashboard. Detailed dashboards are available for areas such as Sales, Stock and Ecommerce, providing additional KPIs, graphs and analysis for that part of the business. Ramsys also offers a host of reporting allowing you to drill right down to the individual transaction detail if required.
This makes the Overview the recommended starting point for reviewing business performance: identify an area requiring attention, then move directly to its detailed dashboard for further investigation.
A practical daily management routine
This dashboard is designed to be read from top to bottom.
Start with the headline KPIs: Are Sales, GP%, Transactions and IPS where you expect them to be?
Next look at the store table: Is the result widespread, or is a particular store or region driving it?
Then diagnose the reason using Transactions, Average Sale, IPS, GP%, Returns and Budget performance.
Finally look at the trend graph: Is the situation improving or deteriorating as the period progresses?
When something requires investigation, drill into the detailed information rather than trying to make a decision from one KPI.
Look for relationships, not isolated numbers
The greatest value of the Retail Sales Dashboard comes from looking at several measures together.
For example:
|
What you see |
What to investigate |
|
Sales down, Transactions down |
Customer traffic, conversion, store activity |
|
Sales down, Transactions stable |
Average Sale, IPS, product mix |
|
Transactions up, Sales flat |
Average Sale and basket value |
|
IPS falling |
Add-on selling, product availability, merchandising |
|
GP% falling |
Discounting, promotions, product mix |
|
Returns increasing |
Products, quality, customer expectations |
|
One store falling behind |
Compare its Transactions, Avg Sale, IPS and GP% with similar stores |
|
Budget behind but trend improving |
Continue monitoring — current momentum may be recovering |
|
Sales unexpectedly low and Last Sync old |
Check communications before assessing performance |
|
Ecommerce Sales unusually low |
Check ecommerce orders have been downloaded and processed |
The objective isn't to spend the morning studying reports. It is to identify exceptions quickly, understand what is driving them, and direct attention to the parts of the business where action can make a difference.
