LeaderBoard
Dashboard - Leader board
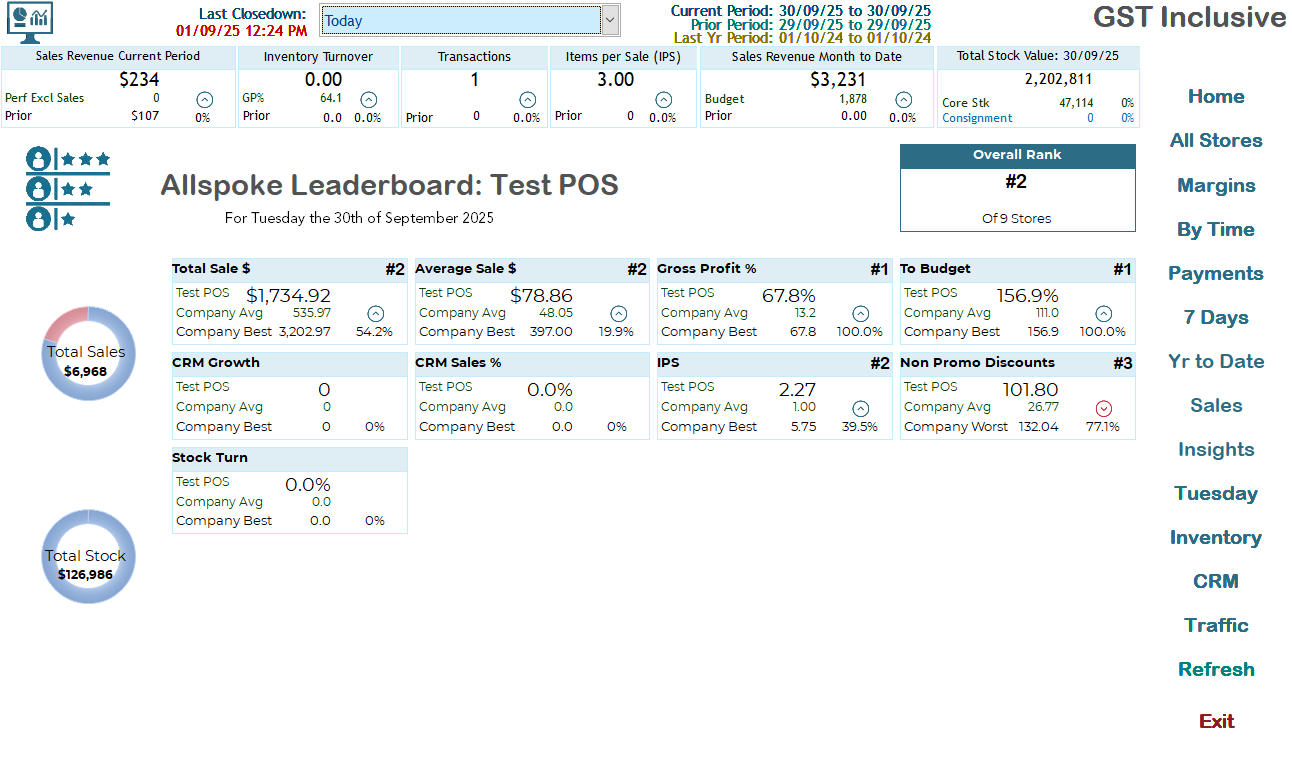
The Leader board page presents a comprehensive view of sales performance metrics for the local store. It enables users to assess their performance in comparison to other stores and company averages, showcasing key performance indicators (KPIs) effectively.
Key Sections
- Title: Displays the leader board title, indicating the specific store and date.
- Overall Rank: Shows the store's ranking among all participating stores (e.g., `#2 of 9 Stores`).
Sales Metrics
This section provides an overview of several critical sales figures:
- Total Sales:
- Displays the total sales for the store and its rank compared to others.
- Average Sale $:
- Indicates the average amount per transaction.
- Gross Profit %:
- Reflects the percentage of revenue that exceeds the cost of goods sold (COGS).
- To Budget %:
- How close the store is to achieving their budget.
- 100% – Budget fully achieved.
Over 100% – Budget exceeded, indicating exceptional performance.
Below 100% – Indicates how much remains to reach the budget.
- CRM Growth:
- Measures customer relationship management effectiveness. How many Customers have been added to the database.
- CRM Sales %:
- Represents sales attributed to customer relationships.
- IPS:
- Displays the average value of sales per transaction. This helps identify trends in customer purchasing behaviour and highlights high-value transactions.
- Non Promotional Discounting:
- Shows the total value of discounts given on sales beyond running promotions. Note that standard promotional discounts are not included in this figure. This metric helps monitor discretionary discounting and assess its impact on overall sales performance.
- Stock Turn:
- Indicates how frequently inventory is sold and replaced over a period.
The Leader board is an essential tool for motivating teams and driving performance by making budget targets and achievements immediately visible.
Comparison Metrics
Each metric features:
- Current store's performance.
- Company Avg: Average performance across all stores.
- Company Best: Best recorded performance for reference.
Visual Elements
Graphs and pie charts visually represent data, enhancing understanding at a glance. Key visual elements include:
- Progress Circles: Illustrate total sales and stock levels for the store as a % of Total for the company..
- Ranking Icons: Indicate performance ranks for various metrics.
Usage Tips
- Regularly check this page for an up-to-date performance snapshot.
- Use the comparison metrics to identify areas for improvement.
- Pay attention to the visual elements for a quick assessment of your performance standing.
Utilising the Leader board page helps in achieving better sales performance by providing clear insights into your standing and operational efficiency. Regularly reviewing these metrics can drive data-informed decisions and strategies for improvement.