By Time
Sales By Time
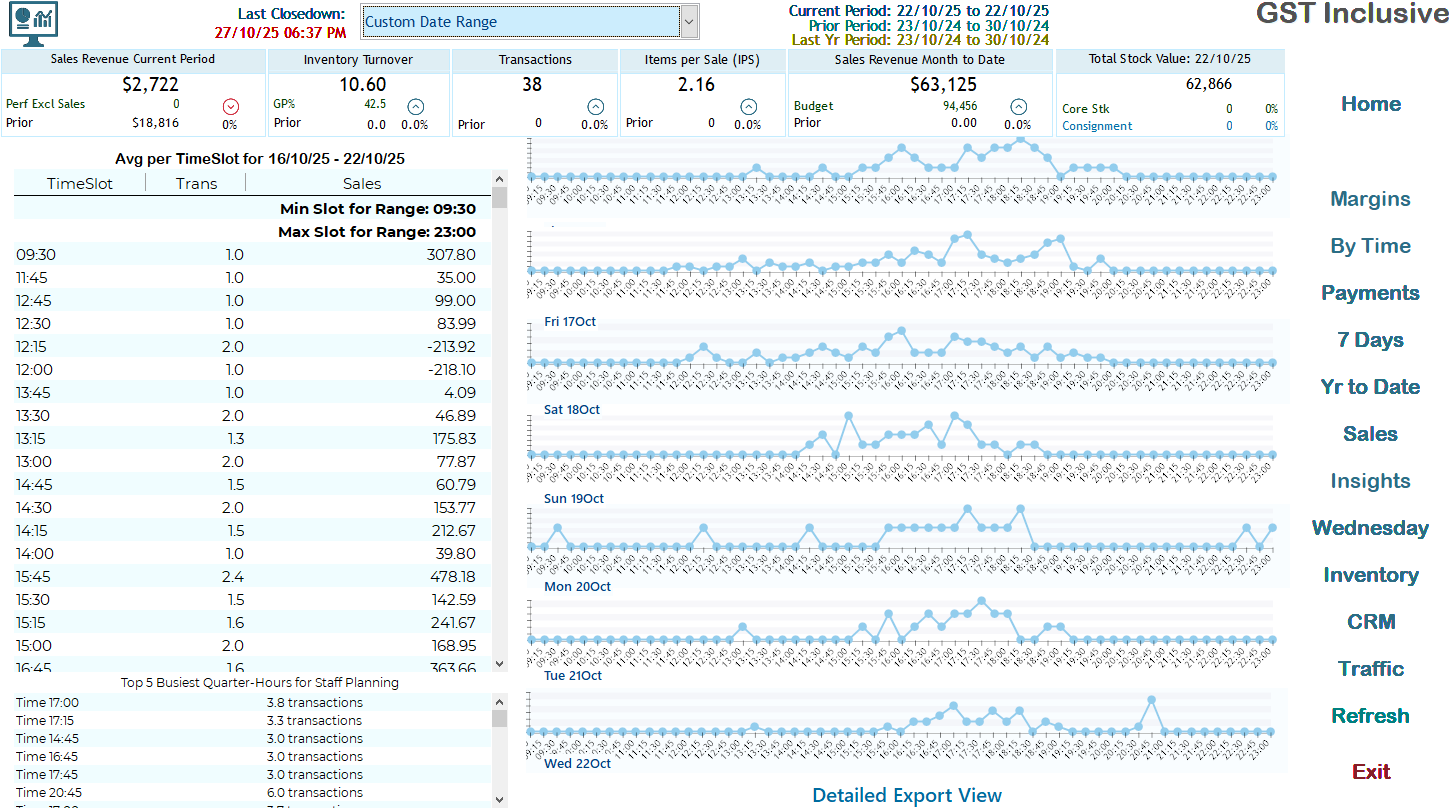
The Sales by Time Dashboard provides a detailed analysis of transaction volume and sales trends during different times of the day for a selected week. This tool is optimised for evaluating performance across time slots, assisting businesses in identifying peak periods for sales activity and making data-driven decisions for staff planning and resource allocation.
The example shown represents sales trends for the week ending October 22, 2025, offering insights per time slot, daily trends, and overall patterns.
Data Table Details
- Columns Overview
- TimeSlot: Indicates the time intervals (e.g., 09:30, 11:45, etc.) when sales activities are recorded.
- Trans: Displays the average number of transactions during that time slot for the selected week.
- Sales: Represents the average sales amount for that time slot, in monetary values.
- Insights Highlighted:
- Minimum Slot Range: The time period with the lowest average sales or activity (e.g., 09:30 in this case).
- Maximum Slot Range: The time period with the highest average sales or activity (e.g., 23:00 in this case).
Line Charts Analysis
- Each daily line chart corresponds to a specific day in the selected week (e.g., Friday, Saturday, etc.).
- Purpose:
- Visualises fluctuations in transaction volume across the day.
- Peaks and troughs represent the most and least active time slots.
- Example Analysis: On Monday (Oct 20), a significant rise in activity occurs at 15:45, indicating an afternoon sales spike.
Staff Planning Insights
Near the bottom of the screen, there is a summary of the Top 5 Busiest Quarter-Hours for Staff Planning. These data points are critical for ensuring adequate staffing during peak demand times:
- Example:
- 20:45: 6.0 average transactions
- 17:00: 3.7 average transactions
This section allows managers to efficiently schedule shifts, focusing on times with higher transaction volumes.
User Interactions
- Time Ranges:
- Click on the drop-down to select a custom time slot or predefined range for deeper filtering. the range will be the previous 7 days before the last date of the range selected.
- Chart Tooltips:
- Hover over data points to view precise transaction volume and sales for each time slot.
- Detailed Export View:
- This will produce a report of the Base data used to calculate these stats. once onscreen you can print/email/save this data.
Common Use Cases
- Staff Scheduling: Identify peak periods requiring more personnel.
- Marketing Campaigns: Run promotions during high-traffic time slots.
- Performance Monitoring: Detect under-performing periods through the Min Slot Range as well as busy periods (Max Slot Range).
Summary
The Sales by Time Dashboard is an essential tool for tracking sales activity by time slot and optimising operations. Use it to monitor trends, improve staff scheduling, and enhance sales strategy for better resource management.