Margins
Margin/Discount Tracking Screen
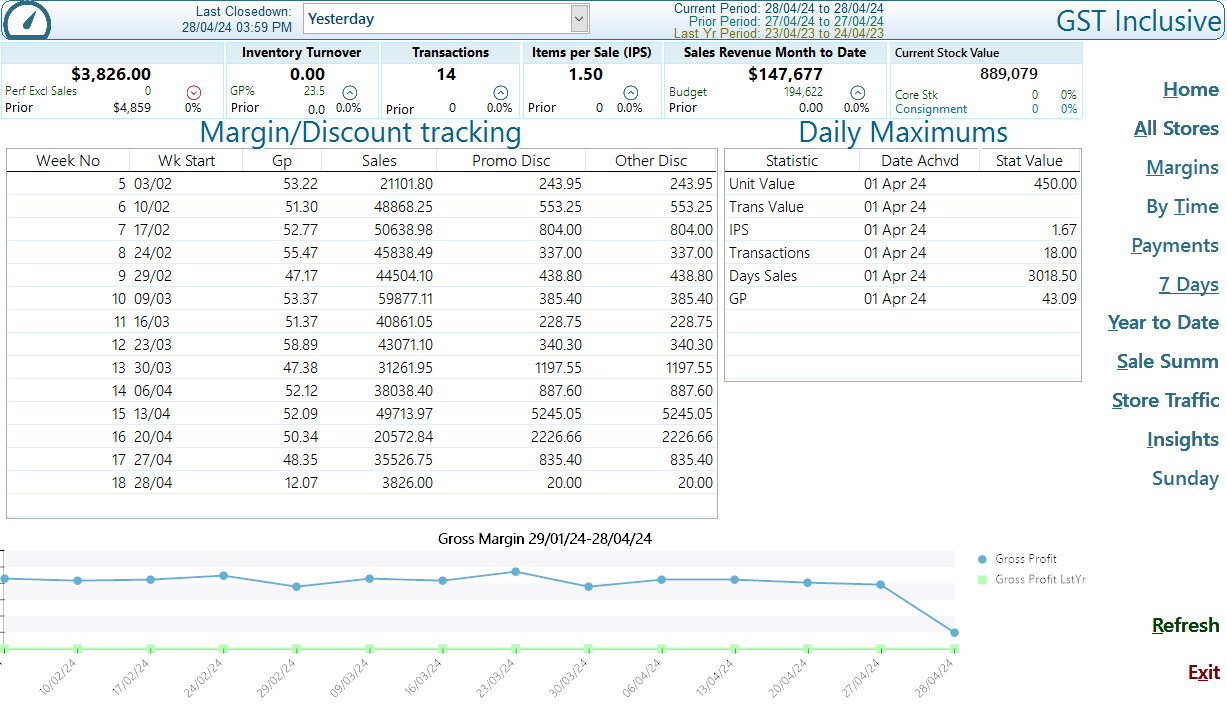
This screen presents a detailed financial performance report covering metrics such as weekly gross profit, discounts, and daily maximums. It serves as a valuable tool for analysing sales performance and understanding discount impacts over time.
Key Features
- Margin/Discount Tracking Table: Displays weekly sales and discount metrics, including gross profits (Gp) and various discount categories.
- Daily Maximums: Highlights key performance indicators recorded on specific dates to help assess daily sales activities.
- Trend Analysis: A visual representation of gross profit trends over the reporting period.
Margin/Discount Tracking Table:
- Columns: Week No, Wk Start, Gp, Sales, Promo Disc, Other Disc.
- Data Overview:
- Gp: Gross profit for the week.
- Sales: Total sales amount.
- Promo Disc/Other Disc: Amount of promotional and other discounts applied.
Daily Maximums Section:
- Unit Value: Maximum units sold on a specific date.
- Transactions: Number of transactions conducted.
How to Use
- Review Weekly Analytics: Examine the Margin/Discount Tracking Table to analyse weekly gross profits and discounts.
- Assess Daily Performance: Check the Daily Maximums to identify sales peaks and transaction activity.
- Analyse Trends: Use the provided trend graph to observe patterns in gross profit.
Tips and Tricks
- Monitor Discount Impact: Regularly review promo and other discounts against sales to gauge effectiveness.
- Track Performance Over Time: Use trend lines to set benchmarks for future sales and discount strategies.
- Identify Outliers: Look for weeks with significant drops in gross profit or sales to investigate underlying causes.
Conclusion
This screen consolidates crucial financial metrics, facilitating informed decision-making to enhance sales strategies and profitability.