Inventory
Inventory
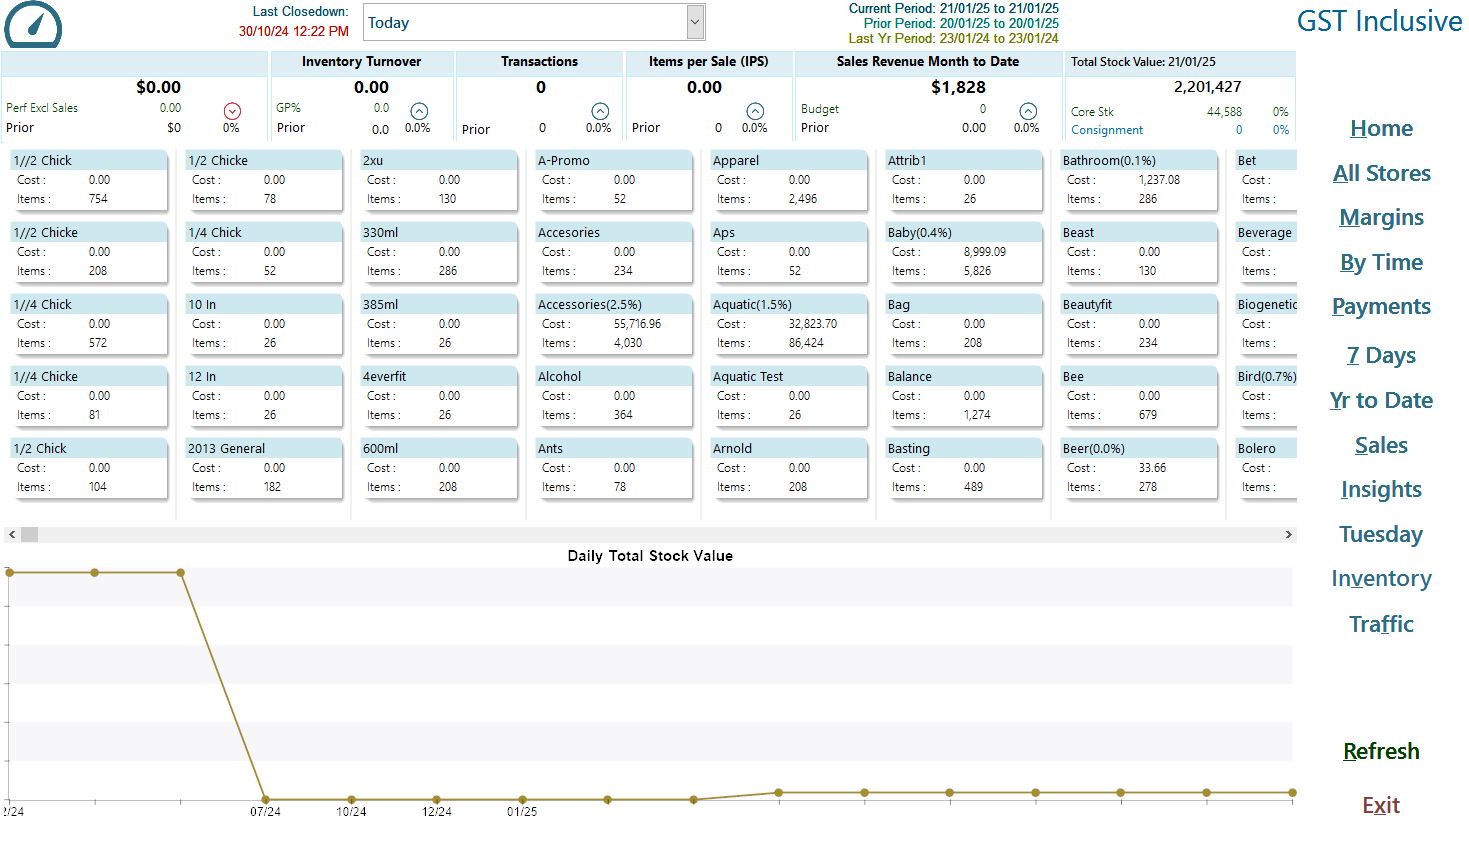
The Inventory and Sales Dashboard provides a consolidated view of key metrics for managing stock levels and sales performance. This screen is essential for monitoring inventory turnover, sales revenue, and total stock value, facilitating informed decision-making.
Summary Data
- Sales Revenue Current Period: Displays the total sales revenue for the current period.
- Inventory Turnover: Indicates the efficiency of inventory management indicating what inventory has moved during the reported period.
- Transactions: Tracks the number of sales transactions, compared to prior periods, reflecting sales activity.
- Items per Sale (IPS): This value indicates the average number of items sold per transaction, currently showing 0.0.
Detailed Inventory Data
Item Categories: Each item category is listed with its respective cost and item count.
Sales Revenue Month to Date
- Shows the month-to-date revenue, providing an insight into current sales performance despite prior zeroes.
Total Stock Value
- The total stock value is displayed , representing the cumulative value of current stock as of the selected end date. This includes core stock and consignment items.
Stock Value Trend Chart
- A graph visualising the Daily Total Stock Value provides insights into trends over the reported period. It highlights stock value consistency with notable spikes, allowing for quick assessment of stock health.
Key Insights
- The dashboard currently reports zero sales activity, emphasising a potential issue in sales or inventory management.
- The high total stock value indicates significant investment in inventory without corresponding sales, which may require immediate review and action.
- Tracking inventory turnover is crucial to understanding product movement and optimising order strategies.
Usage Tips
- Regularly review the dashboard for understanding inventory and sales metrics to optimise stock management.
- Pay attention to discrepancies in expected inventory levels and actual stock value; this could indicate overstock or loss.
- Utilise sales trends to identify periods of high activity and prepare for seasonal demand fluctuations.