Today
Daily Sales Statistics Screen
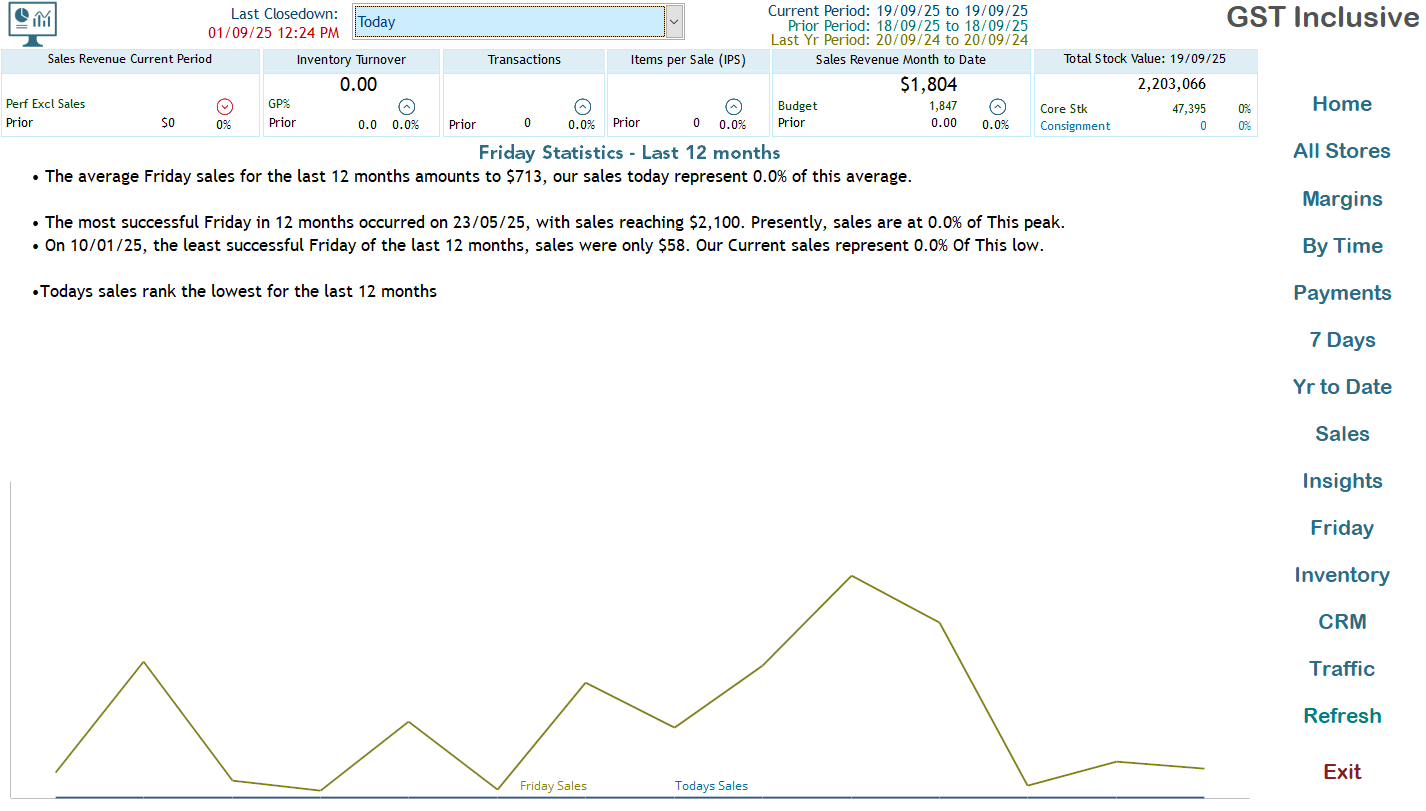
The Daily Sales Statistics screen provides an analytical snapshot of the selected days(in this case Friday) sales performance over the past 12 months, comparing today's sales figures to historical data on the same day. This information is crucial for assessing sales trends and identifying areas for improvement.
Key Insights
- Average Day Sales:
- The average sales for the day over the last year amount to $713. Today's sales are currently at 0.0% of this average, indicating a significant shortfall.
- Most Successful:
- The highest sales figure recorded for this day in the last 12 months. This sets a benchmark for future sales targets.
- Least Successful:
- The lowest day sales, which provides insight into potential challenges faced during that period.
- Current Sales Performance:
- Where does today's sales rank among or days of the same day name for the past year, highlighting a need for action or promotional efforts to stimulate sales.
Sales Trends Chart
A line chart visualises the fluctuations in Friday sales over the past year, clearly depicting peaks and troughs. This visual representation helps in quickly identifying trends, allowing stakeholders to make informed decisions based on historical performance.
Usage Tips
- Regularly monitor the Daily Sales Statistics to keep track of performance and adjust strategies accordingly.
- Investigate possible reasons for low sales today compared to average figures. Consider implementing promotional activities or assessing product offerings.
- Use the historical data not just as a benchmark, but also to motivate team efforts for achieving or exceeding previous highs.