Sales Calendar
Sales Calendar Report
Reports/Sales Calendar
The Sales Calendar Report shows sales activity by day of the week within a selected date range. It highlights sales totals, transaction counts, averages, budget performance, and the effect of promotions and e-commerce sales.
How to Run the Report
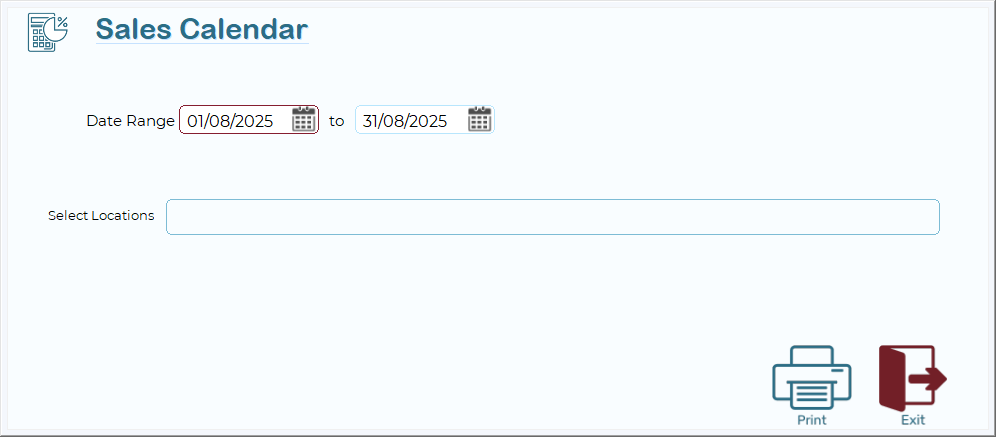
- Open Sales Calendar from the Reports menu.
- Select the Date Range (From / To).
- Example: 01/08/2025 to 31/08/2025.
- (Optional) double click to select one or more Locations.
- If left blank, all locations will be included.
- Press Print to generate the report.
Report Layout
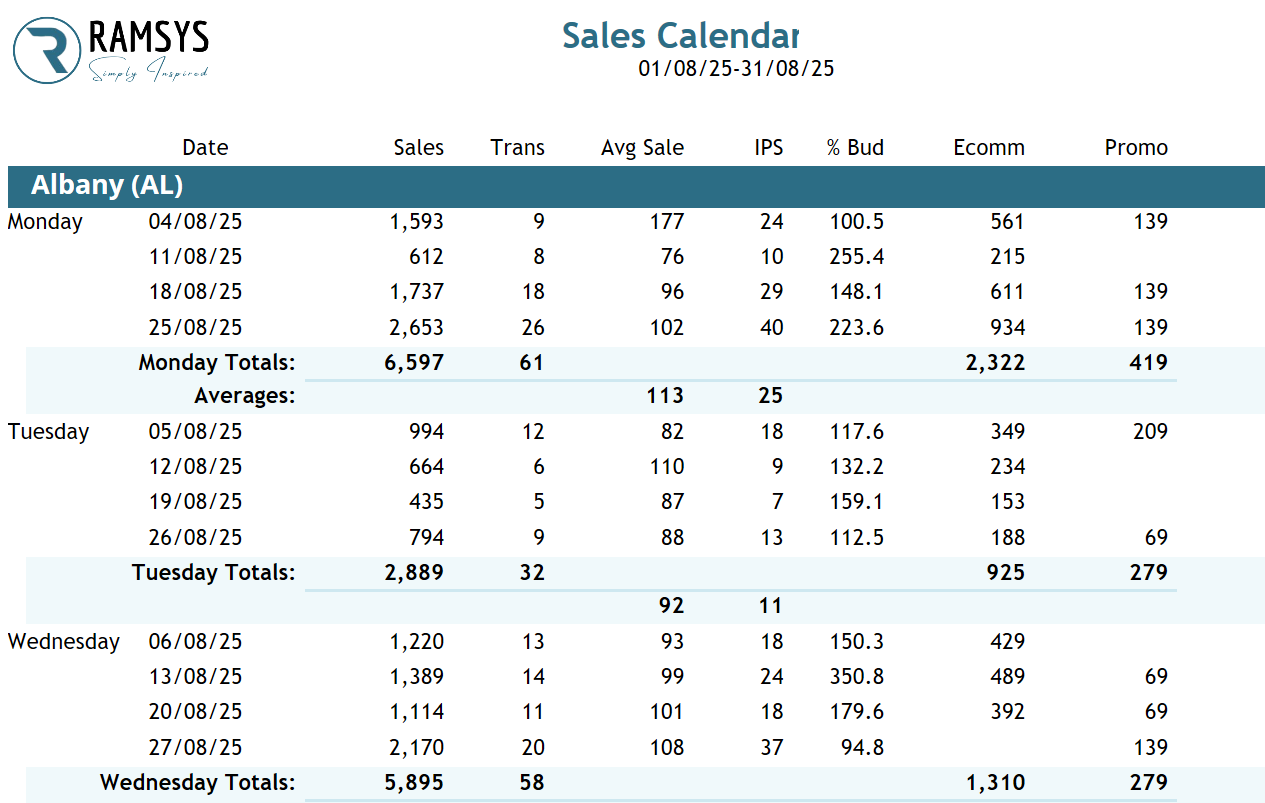
The report is grouped by day of the week (Monday to Sunday). Each day shows a list of dates in that range, along with totals and averages.
Columns:
- Date – The calendar date.
- Sales – Total sales value for that day.
- Trans – Number of transactions.
- Avg Sale – Average sale per transaction.
- IPS – Items per sale.
- % Bud – Percentage of budget achieved.
- Ecomm – Value of online/e-commerce sales.
- Promo – Value of promotional sales.
Grouped Data:
- Daily Detail – Each line represents a calendar day.
- Day Totals – Sum for all dates of that weekday.
- Averages – Average figures across all dates of that weekday.
Best Use
- Identify which days of the week deliver the strongest results.
- Monitor budget achievement at a glance.
- Review the impact of Promotions and E-commerce sales.
- Spot patterns (e.g., busy Fridays, slower Tuesdays) to adjust staffing or marketing activity.